- Home
- News
- Spotlight on Science
- Combining machine...
Combining machine learning and X-ray emission spectroscopy to predict the structure of matter under pressure
16-03-2023
Machine learning was applied to analyse the simulated X-ray emission spectra of compressed germanium oxide glass and to predict changes in its structure under pressure. The method has a large potential to predict the structures of materials under extreme pressures in the Earth’s mantle.
Share
The structure of amorphous and crystalline germanium oxide (GeO2) under high pressure has been a long-standing subject of study. Besides technological applications, it is used as a proxy to silicon oxide (SiO2), the main component in silica melts present in the Earth’s mantle, but at lower pressures that are more easily accessible experimentally. Detailed structural knowledge of the compaction mechanisms in these simple glasses will aid our understanding of geological, geochemical and geophysical processes involving more complex silicate glasses and melts.
X-ray spectroscopy provides detailed information on the structure of material at the atomic level; however, interpretation of X-ray emission spectra (XES) is not always straightforward, especially in the case of soft condensed or amorphous matter, such as GeO2, which does not give well-resolved diffraction patterns because its atoms are not arranged in a highly ordered lattice like crystalline solids. The most important parameter to describe the structure of amorphous GeO2 is the average number of nearest oxygen neighbours to germanium, i.e., its average coordination number (CN). To complicate matters, this can change under increasing pressures.
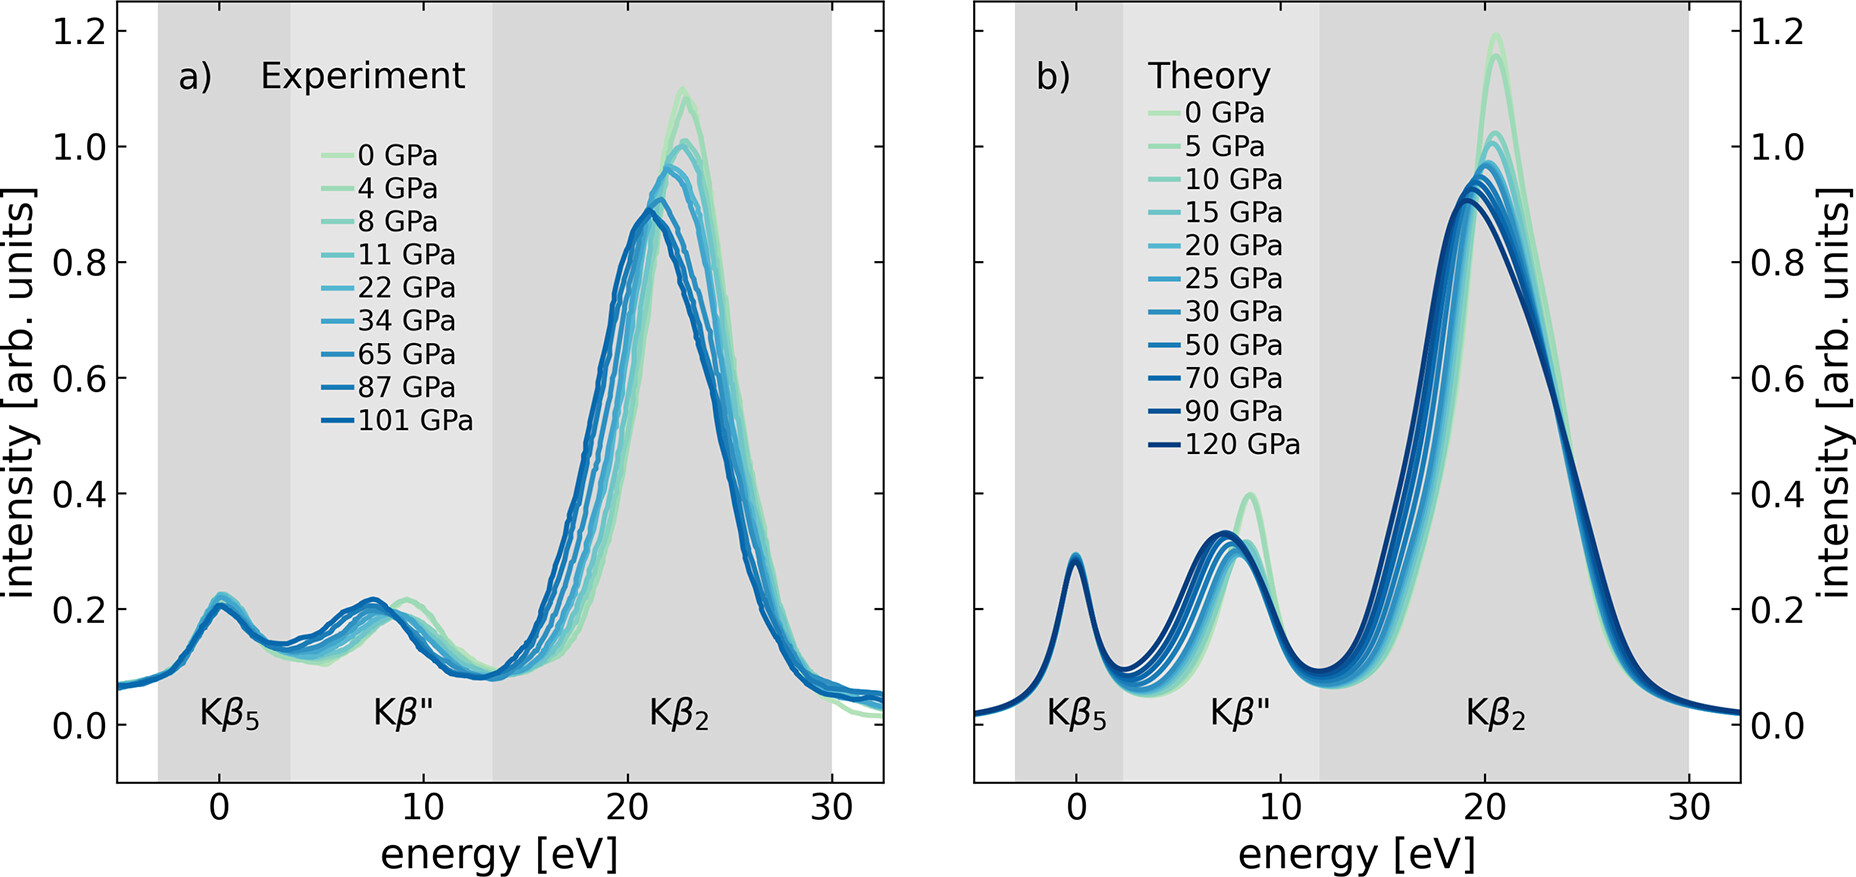
Previous studies using valence-to-core X-ray emission spectroscopy (VTC XES) measured the spectra of amorphous GeO2 compressed inside a diamond anvil cell to pressures between ambient and 101 GPa (Figure 1a) [1]. One of the features of VTC XES spectra is the Kβ″ X-ray emission line, which can give insights into the CN and the distance between nearest neighbour atoms, demonstrating the potential of this technique for structural characterisation of the amorphous state.
In the first part of this work, the potential of this technique for the structural characterisation was further substantiated on the basis of theoretical spectra of compressed amorphous GeO2 and crystalline TiO2 structures. The spectra, computed within one of the most accurate theoretical frameworks to describe electronic structure, are capable of reproducing the experimental spectra to a high degree, as illustrated in Figure 1b. This makes it possible to investigate the relation between the Kβ″ emission line shift and CN over the entire pressure range in a quantitative way, thereby drastically improving the reliability of the method.
Click figure to enlarge
Fig. 1: a) Experimental Kβ valence-to-core X-ray emission spectra of compressed amorphous GeO2 from inside a diamond anvil cell at pressures between ambient and 101 GPa [1]. b) Calculated spectra of compressed amorphous GeO2. At each pressure step of the ab initio molecular dynamics simulation, averaged spectra over all individual Ge sites are shown, aligned to a common position of the Kβ5 emission line.
As a follow-up of this previous work, a machine-learning-based algorithm was utilised to recognise structural degrees of freedom behind largest variance of spectral features. The achieved dimensionality reduction made it possible to solve the inverse problem: to link spectral features with the atomic structure most likely to produce them. Structural information was encoded into a Coulomb matrix of the local atomic structure around the site of characteristic X-ray emission, from which the statistical moments of Kβ″ and Kβ2 emission lines in the spectrum could be reliably predicted with a training set of ∼ 104 samples. Emulator-based component analysis (ECA) was then used to study known structural information for spectral changes occurring under different pressures. When applying this method to the moments of the ensemble-mean spectrum, the reconstructed interatomic distances from the active site matched closely with those of the ensemble mean, and the pressure-induced structural changes in amorphous GeO2 were reproduced with good accuracy, as shown in Figure 2.
Click figure to enlarge
Fig. 2: a-c) Sample XES spectra at different pressures. For each spectrum, the inset shows the corresponding 3D structure, where the active Ge site is yellow, other Ge sites are pink and O sites are red. The symbols are used to indicate the data point in the panels below. d-k) Results of the machine-learning training: predicted spectral moments of the evaluation data set for the Kβ′′ (d-g) and Kβ2 peak (h-k). The colour of each point indicates the corresponding pressure for the structure, and coloured crosses in every panel depict the mean values for each pressure subset (known: moments of known mean spectrum; predicted: mean of predicted moments). Positions of the sample spectra from panels (a-c) are marked with black markers. Number in every panel shows the Pearson correlation coefficient r between known and predicted data.
This approach makes it possible to quantitatively analyse structural changes that can be inferred from the changes in the Kβ emission spectrum alone. Moreover, as the new analysis procedure by dimensionality reduction is not specific to amorphous oxides, it may be used in more complicated and nuanced spectroscopic investigations in the future.
Principal publications and authors
Sensitivity of the Kβ″ X-ray Emission Line to Coordination Changes in GeO2 and TiO2, G. Spiekermann (a), C.J. Sahle (b), J. Niskanen (c), K. Gilmore (d), S. Petitgirard (a), C. Sternemann (e), J.S. Tse (f), M. Murakami (a), J. Phys. Chem. Lett. 14, 7, 1848-1853 (2023); https://doi.org/10.1021/acs.jpclett.3c00017
(a) ETH Zürich, Zürich (Switzerland)
(b) ESRF
(c) Department of Physics and Astronomy, University of Turku, Turun yliopisto (Finland)
(d) Physics Department and IRIS Adlershof, Humboldt Universität zu Berlin, Berlin (Germany)
(e) Technische Universität Dortmund, Fakultät Physik/DELTA, (Dortmund) Germany
(f) Department of Physics and Engineering Physics, University of Saskatchewan, Saskatoon (Canada)
Towards structural reconstruction from X-ray spectra, A. Vladyka (a), C.J. Sahle (b), J. Niskanen (a), Phys. Chem. Chem. Phys. 25, 6707-6713 (2023); https://doi.org/10.1039/d2cp05420e
(a) Department of Physics and Astronomy, University of Turku, Turun yliopisto (Finland)
(b) ESRF
References
[1] G. Spiekermann et al., Phys. Rev. X 9, 011025 (2019).
Top image: The principle of spectral moment prediction for a Ge Kβ XES peak for amorphous GeO2. A Coulomb matrix (i.e., a global 3D representation of molecular structure) is generated from a structure, and is fed as input into a computer algorithm, which is trained to predict spectra for the structure (see original publication for more details: https://doi.org/10.1039/d2cp05420e).
partners


European Synchrotron Radiation Facility - 71, avenue des Martyrs, CS 40220, 38043 Grenoble Cedex 9, France.