- Home
- Impact of manganese on primary hippocampal neurons in rodents
Impact of manganese on primary hippocampal neurons in rodents
X-ray fluorescence (XRF) imaging was used to map the spatial distribution of manganese in neurons to help in an assessment of the safety of manganese enhanced magnetic resonance imaging (MEMRI).
Manganese is an increasingly important contrast agent for MRI, which is now widely used to image the internal body structures of rodents and non-human primates. Mn2+ is an MRI contrast agent [1] and, as a divalent ion, Mn2+ can substitute calcium (Ca2+) by entering active neurons through Ca2+ channels [2] and can participate in axonal transport [3]. The unique ability of Mn2+ to image brain cytoarchitecture and connectivity makes MEMRI particularly effective for studying neurodegenerative diseases. However, at high doses, manganese is toxic for neurons and glial cells.
We have addressed the impact of Mn2+ on cells in culture: mouse hippocampal neurons (HN) and Neuro2a neuroblastoma cells (N2a, a neuron-like cell) using several different approaches. Here we summarise the main results obtained in HN cells.
XRF microscopy, carried out at the ID21 and ID22NI (now at ID16B) beamlines, showed that HN cells not exposed to exogenous MnCl2 naturally contain 5 µg/g of Mn, a result in line with a previous study [4]. A 24h exposure to a Mn2+ concentration leading to 50% lethality (100 µM) yielded an intracellular Mn concentration of 248 µg/g for HN cells.
 |
|
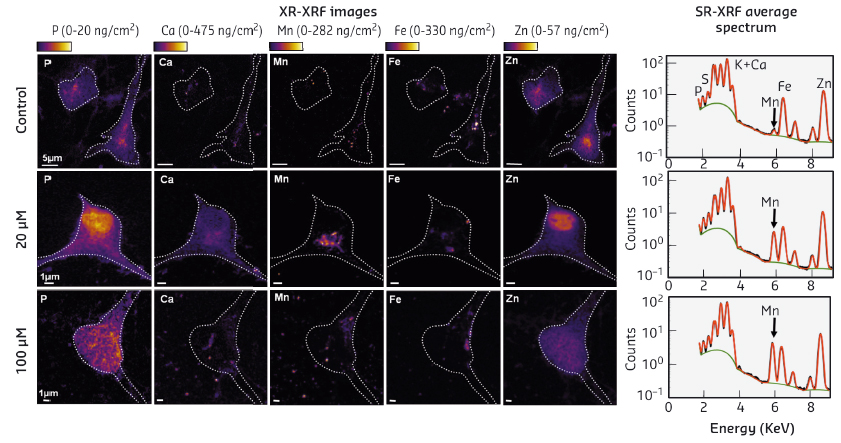
Fig. 51: Map of metal distribution in hippocampal neurons obtained by SR-XRF. Left: Two-dimensional elemental distribution in HN 24 h after adding different concentrations of Mn2+ to the culture medium: 0 (control), 20, and 100 µM of Mn2+. Cell contours appear as a white dotted line. The colour scale is in mg of element per g of dry weight. Right: Normalised XRF spectra, averaged over the entire map. The green line corresponds to the baseline and the red line to the fit. |
In control HN and HN exposed to moderate concentration of Mn2+ (20 µM), phosphorus (P) and zinc (Zn, not detected for N2a) were mostly found in the cell nucleus (Figure 51). After adding a high concentration of Mn2+ to the culture medium (100 µM), the distributions of P and Zn became much more heterogeneous. In control HN, Ca and Fe were barely detectable whereas, after adding a moderate concentration of Mn2+ to the culture medium (20 µM), Ca and Fe were clearly visible and localised in the perinuclear, Mn2+ rich, region. At a higher Mn2+ concentration (100 µM), Ca and Fe were redistributed throughout the cytoplasm. Note that the distribution of Zn and Cu in HN did not change upon addition of Mn2+.
 |
|
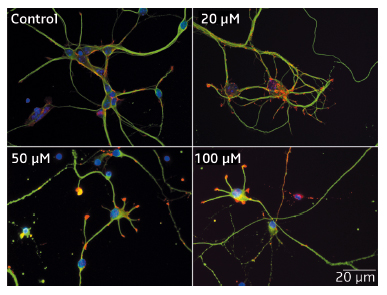
Fig. 52: Impact of Mn2+ on the morphology of hippocampal neurons. After 48 h in culture, HN were exposed to Mn2+ for 24 h. Four concentrations of Mn2+ were used: 0 (control), 20, 50, and 100 µM. Immunofluorescence labelling: neuronal fibrillar actin (red), tubulin (green) and nucleus (blue). The reduction in neuritic length as Mn2+ concentration increases is readily visible. |
Immunofluorescence studies of HN neurons revealed that concentrations of Mn2+ below LC50 (90 µM) shortened neuritic length and decreased mitochondria velocity after 24 h of incubation (Figure 52). Similar concentrations of Mn2+ also facilitated the opening of the mitochondrial permeability transition pore in isolated mitochondria from rat brains.
This study reports a number of new observations on the impact of Mn2+ on cultured HN. When cells are exposed to a concentration of Mn2+ below the LC50, Mn is preferentially localised around the nucleus, most likely in the Golgi apparatus or in the endoplasmic reticulum, and in discrete spots in neurites. When neurons are exposed to a concentration of Mn2+ above the 50% lethality level, the distribution of Mn becomes more diffuse within the cell, suggesting a mechanism of cell detoxification. Exposure of cultured HN to Mn2+ also induced a shortening of neurites, and a decrease of mitochondria velocity. Altogether, these data support the use of primary neuronal cultures as a model to study Mn2+-induced toxicity in the brain. Future experiments should be performed on co-cultures of astrocytes and neurons to better mimic brain anatomical conditions.
Principal publication and authors
A. Daoust (a,b), Y. Saoudi (a,b), J. Brocard (a,b), N. Collomb (a,b), C. Batandier (c), M. Bisbal (a,b), M. Salomé (d), A. Andrieux (a,b), S. Bohic (a,b,d) and E.L. Barbier (a,b), Hippocampus 24, 598–610 (2014).
(a) Inserm, U836, Grenoble (France)
(b) Université Joseph Fourier, Grenoble Institut des Neurosciences (France)
(c) Laboratoire de Bioénergétique Fondamentale et Appliquée, Grenoble (France)
(d) ESRF
References
[1] A.P. Koretsky and A.C. Silva, NMR Biomed 17, 527–531 (2004).
[2] K. Narita, F. Kawasaki and H. Kita, Brain Res 510, 289–295 (1990).
[3] R.G. Pautler, NMR Biomed. 17, 595–601 (2004).
[4] A. Daoust, E.L. Barbier and S. Bohic, NeuroImage 64, 10-18 (2013).
Acknowledgements
The authors acknowledge the support of the Grenoble MRI Facility (IRMaGe) and the ESRF for provision of synchrotron radiation beamtime (respectively, exp. MD-458, MD-548). AD received a stipend from the Région Rhône-Alpes – Cluster HVN.
partners


European Synchrotron Radiation Facility - 71, avenue des Martyrs, CS 40220, 38043 Grenoble Cedex 9, France.