Figure 54
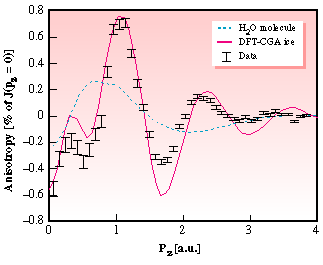
Fig. 54: Experimental Compton profile anisotropy (dots) in ice Ih plotted as a function of electronic momentum in atomic units. Also shown are calculations for a fully quantum mechanical bonding model (DFT-GGA, red line) and a purely electrostatic bonding model (H2O, blue line).
partners


European Synchrotron Radiation Facility - 71, avenue des Martyrs, CS 40220, 38043 Grenoble Cedex 9, France.