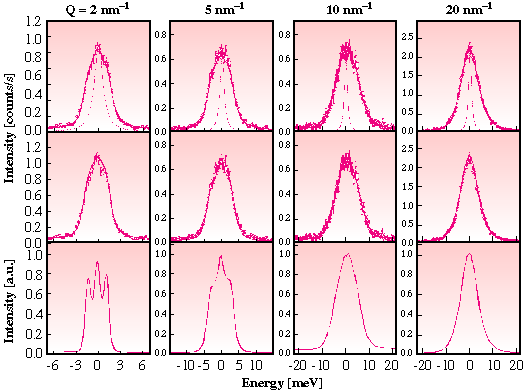
Figure 51
Fig. 51: Selected IXS and MD spectra of neon gas at T = 295 K and 3 kbar at the indicated Q values. (Row a): IXS data (o) at the indicated Q values with their error bars and their fit (solid line). The narrow dashed line, centered at E = 0, is the measured total energy resolution function. (Row b): Comparison between the experimental (o) and MD spectra (solid line), after having taken into account the experimental resolution function and the detailed balance. (Row c): MD non-convoluted spectra.
partners


European Synchrotron Radiation Facility - 71, avenue des Martyrs, CS 40220, 38043 Grenoble Cedex 9, France.