Figure 40
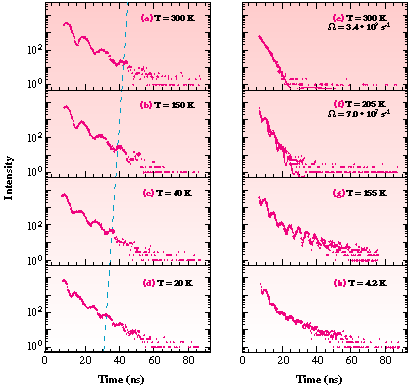
Fig. 40(a)-(d): NFS on EuNi2P2 as a function of temperature with divalent EuS as reference sample. The dashed line is an eye-guide that indicates the frequency change of the quantum beat pattern with temperature.
Fig. 40(e)-(h): Eu3S4 at different temperatures. Full lines are simulations assuming fluctuations between the two valence states in Eu3S4. Values for the flip frequencies ![]() are given in (e),(f).
are given in (e),(f).
partners


European Synchrotron Radiation Facility - 71, avenue des Martyrs, CS 40220, 38043 Grenoble Cedex 9, France.