Figure 60
Fig. 60:
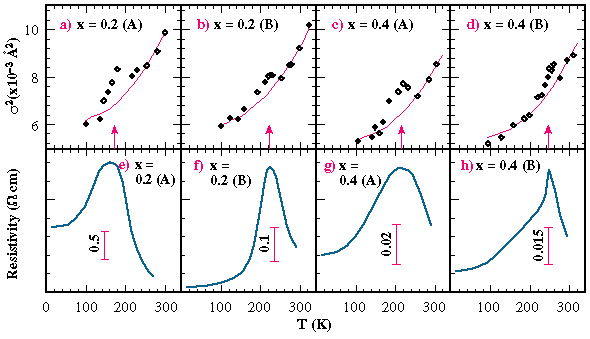
a-d) Experimental Debye-Waller disorder factors (diamonds) as a function of temperature for the four samples respectively. The data deviate from a phonon-like behaviour (red lines) in the region of the MI-transition (arrows).
e-h) Resistivity curves as a function of temperature for the four samples respectively. The strong correlation between the non-Debye contribution and the resistivity peaks is evident.
partners


European Synchrotron Radiation Facility - 71, avenue des Martyrs, CS 40220, 38043 Grenoble Cedex 9, France.