- Home
- Experimental procedure for the characterisation of radiation damage in macromolecular crystals
Experimental procedure for the characterisation of radiation damage in macromolecular crystals
Radiation damage caused by ionising radiation is a constant source of concern when collecting X-ray diffraction data from crystals of biological macromolecules. As the dose absorbed by the crystal increases, changes in the unit cell parameters and crystal mosaicity, along with reduction in diffraction intensity of high-angle spots are observed. These radiation-induced effects are sample-dependent and are proportional to the absorbed dose. Accurate dose estimation is thus essential to determine crystal tolerance to X-rays and consequently to determine an optimal data collection strategy.
When the sample sensitivity or X-ray beam calibration (flux, size, etc.) are uncertain, a reliable standardised procedure to calibrate a linear damage model is necessary through a preliminary experiment, sacrificing the whole or part of a crystal. We have therefore established a new procedure to determine crystal sensitivity to radiation damage that involves the measurement of the degree of damage in a sample or in part of it. The procedure describes the variation in scattering power (diffracted intensity and isotropic B factors) as a function of X-ray exposure time in a reliable and reproducible way. To achieve this, the data collection strategy planning software BEST [1], has been modified so that it can carry out a “burn strategy”: eleven successive data collection wedges, interleaved with long X-ray exposures to “burn” the crystal. The data wedges are collected from a relatively narrow crystal rotation range in order to minimise the influence of non-homogeneous irradiation. The data are finally analysed and interpreted to provide both a calibration and a linear B-factor decay model.
 |
|
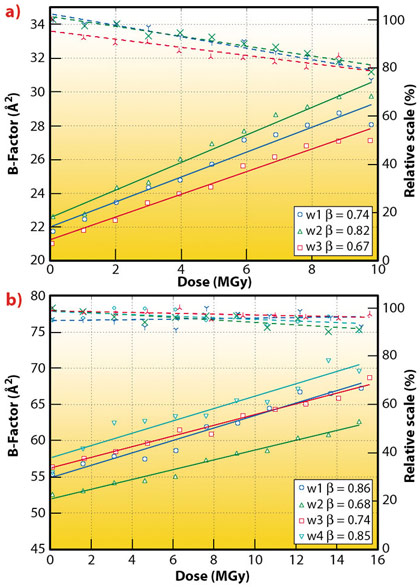
Fig. 124: Illustration of the plots resulting from the automated ‘burn strategy’ procedure for the determination of the radiation damage rate as applied to two protein crystals. Relative scales (overall scale normalised to the maximum value for all the wedges) and B-factors against nominal dose. A linear fit of the B-factors vs dose is used to calculate the decay rate (or sensitivity coefficient). Full lines represent B-factors and dashed lines relative scales. For a thermolysin crystal (a), the procedure was applied three times yielding crystal sensitivity coefficients between 0.62 and 0.67 Å2MGy-1. For a crystal of RecR from Deinococcus radiodurans (b), the sensitivity coefficients from the four collected wedges was found to vary between 0.68 and 0.86 Å2MGy-1. |
The method has been implemented at the ESRF MX beamlines in an automated procedure using the EDNA online data analysis framework [2] and the MxCuBE data collection control interface [3]. The EDNA framework provides an automated crystal characterisation and data collection protocol whereas MxCuBE allows the user to monitor and, if desired, to drive the whole process. To minimise the computing time, the diffraction images from the eleven successive data collection wedges are submitted to the ESRF batch scheduler and thus processed in parallel. The resulting plots and crystal decay coefficients are displayed to the user a few seconds after the last X-ray diffraction image is collected. The information extracted from this procedure can be directly used for optimal planning of data collection by the strategy software program BEST [1]. Using test crystals with well known radiation sensitivity, the procedure can also be used at the beamlines to verify and calibrate X-ray flux and beam size.
The observed dependency of the scale and B-factor on the X-ray dose presented in Figure 124 clearly confirms the practical applicability of this method. The linearity in the observed B-factor dependency on dose strongly supports the choice of the decay rate as a generalised metric of radiation damage. Such experiments are not critically dependent on an accurate knowledge of sample composition (and hence the absorbance), nor on the precise calibration of beam parameters. The method itself has proven to be easy to use and requires minimal user interaction. In practice, the time required for decay characterisation is defined by the incident photon flux density, i.e., a complete procedure could be accomplished in about a minute or two on a modern undulator beamline.
Principal publication and authors
R.M.F. Leal (a), G.P. Bourenkov (b), O. Svensson (a), D. Spruce (a), M. Guijarro (a) and A.N. Popov (a), J. Synchrotron Radiat. 18, 381-386 (2011).
(a) ESRF
(b) EMBL Hamburg Outstation, c/o DESY, Hamburg (Germany)
References
[1] G.P. Bourenkov and A.N. Popov, Acta Cryst. D 66, 409-419 (2010).
[2] M.-F. Incardona et al., J. Sync. Rad. 16, 872-879 (2009).
[3] J. Gabadinho et al., J. Sync. Rad. 17, 700-707 (2011).
partners


European Synchrotron Radiation Facility - 71, avenue des Martyrs, CS 40220, 38043 Grenoble Cedex 9, France.