- Home
- Users & Science
- Scientific Documentation
- ESRF Highlights
- ESRF Highlights 2006
- High Resolution and Resonance Scattering
- Identification of carbide compounds in nanocrystalline Cr deposits by valence-to-core X-ray emission spectroscopy
Identification of carbide compounds in nanocrystalline Cr deposits by valence-to-core X-ray emission spectroscopy
Valence-to-core X-ray emission spectroscopy enables the retrieval of information on the formation of nanocrystalline materials that cannot be accessed by any other technique. Here we report on an application to study the composition of chromium coatings electrodeposited from Cr(III) sulfate electrolytes.
Chromium electroplates exhibit substantial hardness, wear and erosion resistance and are known for their high corrosion-resistive and decorative characteristics. However, due to the toxicity and the difficulties associated with waste utilisation, the conventional process of metal electrodeposition from Cr(VI) electrolytes presents a severe environmental hazard. Therefore, the development of the process of chromium deposition from Cr(III) electrolytes has great interest for its potentially lower toxicity and cleaner process. High-quality coatings can be obtained from Cr (III) electrolyte in the presence of certain organic substances, particularly formic and oxalic acids [1]. The role of organic substances in the electroreduction of Cr(III) still remains unclear. The deposits contain 2–6 wt % of carbon and have a crystallographically amorphous structure with a crystallite size of ~ 2–3 nm, which makes it impossible to reliably identify their phase composition. The aim of our study was to use a direct method to obtain the information on the bulk composition of chromium deposits and the state of carbon in them.
Chromium deposits with a thickness of ~ 30 mm were prepared using known methods [1]. The deposits were separated from the substrate, ground up, mixed with BN powder (1 wt % Cr) and pressed into pellets. The X-ray emission spectroscopy experiments were performed at ID26. The incident energy (6020 eV), which is above Cr K-edge (5989 eV), was selected by means of a pair of Si(220) single crystals. The fluorescence detection was performed using an analyser crystal that employs the (333) Bragg plane of one spherically bent (R = 850 mm) Ge wafer of 89 mm in diameter. The energy bandwidth in the X-ray emission detection was 0.6 eV. The Kß main and Kß satellite lines were measured from 5925 to 5995 eV and then normalised by the integral spectral intensity.
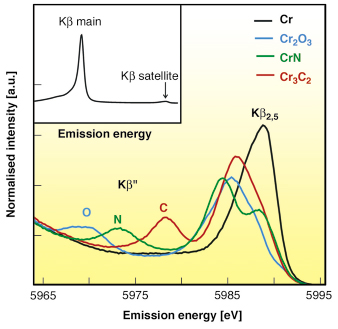
For 3d elements, Kß main lines (Kß1,3) correspond to 3p-1s transition, whereas Kß satellite lines correspond to valence-to-core transitions [2]. Valence-to-core transitions are chemically sensitive since the character of the valence orbitals changes the most between different chemical species. The Kß satellite region is divided into the Kß” or ‘crossover’ peak at lower fluorescence energies and the Kß2,5 structure directly below the Fermi level. Figure 10 shows the Kb satellite lines of metallic Cr, Cr2O3, CrN, and Cr3C2. One can see that the shape of spectra and especially the position of the Kß” peak depends on the local environment of Cr. The Kß main lines of Cr are given in the inset.
 |
|
Fig. 10: The Kß satellite lines of Cr, Cr2O3, CrN, and Cr3C2: O, N and C indicate the positions of the ‘cross-over’ (Kß”) peaks of oxygen, nitrogen, and carbon ligands. The main Kß line of Cr is shown in the inset. |
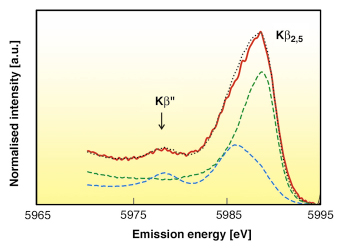
The emission energy of the Kß” can be used as a fingerprint of the presence of Cr-O, C-N, or Cr-C bonds in the sample, which is very difficult to distinguish by conventional X-ray absorption spectroscopy. Figure 11 shows the Kß satellite lines of the S1 sample synthesised electrochemically from Cr(III) solutions containing formic acid. The spectrum of the S2 sample prepared in the presence of oxalic acid is very similar. In both samples, the positions of the Kß2,5 and Kß” peaks clearly indicate the presence of the carbide-like phase. To estimate its concentration, we fitted the spectra of 2,5 satellite lines of the S1 and S2 samples as a linear combination of Cr and Cr3C2 references. For the S1 sample, the fit is shown in Figure 11. The calculated concentrations of chromium atoms in the Cr3C2 local environment in the S1 and S2 samples are equal to 34 and 26 mol. % (this corresponds to 5.0 and 3.9 wt % carbon), respectively.
 |
|
Fig. 11: The spectrum of Kß satellite lines of S1 sample (red line) and its fit (dotted line) by a linear combination of Cr and Cr3C2 references (green and blue lines respectively). |
It follows from these results that:
1. The reduction of Cr(III) to the metal is accompanied by the complete reduction of the organic ligand in the inner coordination sphere of chromium. The majority of the carbon in the chromium deposits is in the form of carbide compounds.
2. The complete reduction of organic ligands points to the high electrocatalytic activity of nanosize metal crystals formed in the electrodeposition, which in fact, catalyse the former process.
References
[1] A.A. Edigaryan, V.A. Safonov, E.N. Lubnin, L.N. Vykhodtseva, G.E. Chusova, Yu.M. Polukarov, Electrochim. Acta. 47, 2775 (2002).
[2] P. Glatzel, U. Bergmann, Coordination Chemistry Reviews 249 (1-2), 65 (2005).
Principal Publication and Authors
V.A. Safonov (a), L.N. Vykhodtseva (a), Yu.M. Polukarov (b), O.V. Safonova (c,d), G. Smolentsev (e), M. Sikora (d), S. Eeckhout (d), P. Glatzel (d), J. Phys. Chem. B, 110, 23192-23196 (2006).
(a) Chemistry Department, Moscow State University (Russia)
(b) A.N. Frumkin Institute of Physical Chemistry and Electrochemistry (Russia)
(c) SNBL, ESRF
(d) ESRF
(e) Rostov State University (Russia)
partners


European Synchrotron Radiation Facility - 71, avenue des Martyrs, CS 40220, 38043 Grenoble Cedex 9, France.