Figure 77

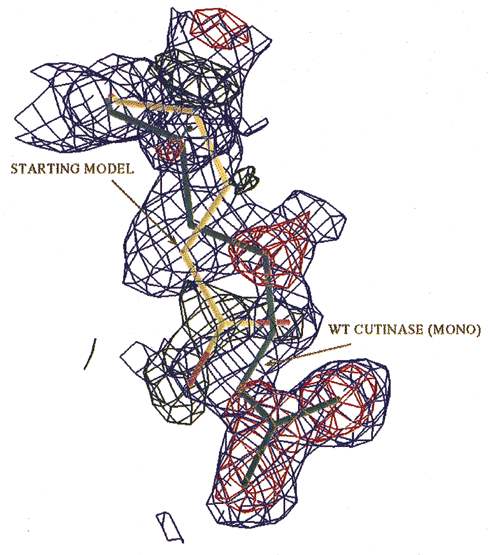
Fig. 77: View of the 2Fobs-Fcalc electron density map contoured at 1![]() (blue), and of the Fobs-Fcalc difference density maps contoured at -3
(blue), and of the Fobs-Fcalc difference density maps contoured at -3![]() (green) and +3
(green) and +3![]() (red), around residue 196, as obtained at the first stage of model refinement of cutinase. The mutated residue Glu196 from the starting model used in the map calculations is represented in atom type colouring, whereas the target wild type residue Arg196 is shown in green. Clearly, the Laue density maps «pull» the starting model towards the true structure.
(red), around residue 196, as obtained at the first stage of model refinement of cutinase. The mutated residue Glu196 from the starting model used in the map calculations is represented in atom type colouring, whereas the target wild type residue Arg196 is shown in green. Clearly, the Laue density maps «pull» the starting model towards the true structure.


