- Home
- Time-resolved elucidation of intermediate species of catalysts in solution
Time-resolved elucidation of intermediate species of catalysts in solution
After the serendipitous discovery of methylrhenium trioxide CH3ReO3 (MTO) in 1979, this compound has been found to be an important active and selective catalyst, able to catalyse a vast variety of reactions, mainly in the liquid phase, that are essential to our lives. Examples of its use are the oxidation of a large amount of organic compounds including olefins, alkenes, aromatics, and sulphur and nitrogen containing compounds; aldehyde olefination and related reactions; and olefin methatesis [1]. Its paramount role in the world of catalysis came not only from the myriad of reactions that MTO catalyses but also because MTO is very easy to synthesise and handle, and it is thermally stable and soluble in practically all sorts of solvents, ranging from pentane to water. When dissolved in water, it has the additional key advantage of making the process environmentally clean, so its use is sought by industry today.
Following an in situ catalytic reaction to reveal the structure of the intermediate species as the reaction progresses has been a long-standing challenge. Achieving this could help researchers develop advanced catalysts with tailor-made properties to enhance selectivity. It is known that methylrhenium dioxide (MDO) is an important intermediate, with strong reducing capabilities, that plays a crucial role in many of the reactions catalysed by MTO. However, until today, its transient existence made it impossible to isolate as a sole structural compound.
To discover the real structure of MTO in solution and elucidate the reaction intermediate MDO during the course of the reaction, we followed the reaction of 20 mM of MTO with 1.6M of H3PO2 in water and acidic medium using the time-resolved stopped-flow/energy-dispersive X-ray absorption near-edge structure (ED-XANES)/UV-visible setup on beamline ID24. The reaction was followed at the Re L3 edge over a period of 90 s with a time resolution of 150 ms. The UV-visible spectrometer was synchronised at the millisecond timescale to gain complementary information and to provide a means of cross-checking the results.
In parallel with the experimental methodology, significant progress has recently been achieved concerning the theoretical analysis of the spectra. In particular, we have developed theoretical algorithms and the software program FitIt [2] for the refinement of the local structure from XANES, which is sensitive to many more structural parameters than EXAFS (more distant coordination shells, in many cases bond angles). For time-resolved data, our approach allows determination of both the percentage of structurally different species as a function of time and the structure of intermediates. This method combines principal component analysis (PCA) of the experimental data, multidimensional interpolation of XANES as a function of structural parameters, and ab initio XANES calculations. FitIt was used here for the analysis of a series of XANES spectra obtained in the time-resolved experiment.
 |
|
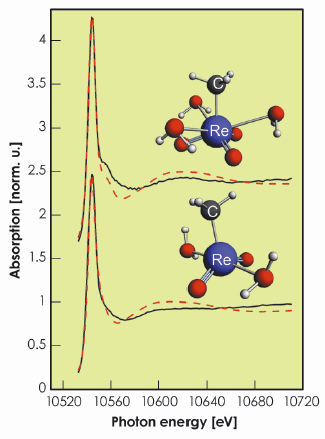
Fig. 100: Re L3-edge XANES spectra of initial (top) and intermediate (bottom) complexes. Experimental (solid line) and theoretical (dashed line) spectra are shown. Structural models are shown in the insert. Re and C atoms are marked; grey (red) spheres are H (O) atoms. |
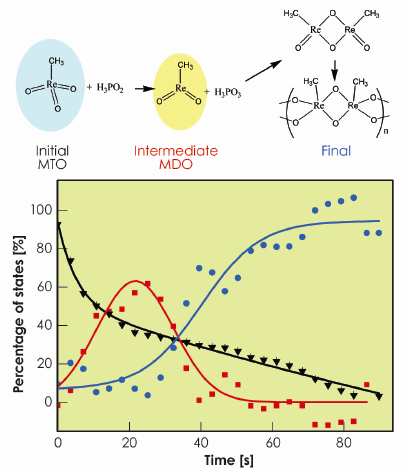
We found that MTO in water has three water molecules coordinated to the metal. The best-fit values of structural parameters are Re=O distance of 1.69 Å and average Re–OH2 distance of 2.85 Å. These results are in agreement with X-ray diffraction and EXAFS fitting results, which gives credit to this method of determining the structures of unknown species. Furthermore, we found that at this time regime the reaction occurs via one single intermediate species (MDO) before polymeric MTO is formed. The best-fit structural parameters for MDO are Re=O distance of 1.71 Å and average Re–OH2 distance of 2.13 Å. Figure 100 shows theoretical and experimental spectra of both initial and intermediate species and Figure 101 shows the corresponding concentration profiles of the reaction.
 |
|
Fig. 101: Chemical reaction of MDO polymerisation and concentration profiles for the initial (black), intermediate (red) and final (blue) states. |
This significant finding illustrates the power and efficiency of this method of analysis for studying reactions in solution, the main advantage being the possibility to fit the structure of phases that cannot be isolated experimentally. This methodology can therefore be applied not only to chemistry in solution but also to a wide myriad of chemical transformations in heterogeneous environments.
References
[1] G.S. Owens, J. Arias, and M.M. Abu-Omar, Catal. Today 55, 31 (2000).
[2] www.nano.sfedu.ru/fitit.html.
Principal publication and authors
G. Smolentsev (a), G. Guilera (b), M. Tromp (c), S. Pascarelli (d) and A.V. Soldatov (a), J. Chem. Phys. 130, 174508 (2009).
(a) Center for Nanoscale Structure of Matter, Southern Federal University, Rostov-on-Don (Russia)
(b) ALBA Synchrotron, Barcelona (Spain)
(c) University of Southampton (UK)
(d) ESRF
partners


European Synchrotron Radiation Facility - 71, avenue des Martyrs, CS 40220, 38043 Grenoble Cedex 9, France.