- Home
- Hot oxygen: the structure of the eta-phase
Hot oxygen: the structure of the eta-phase
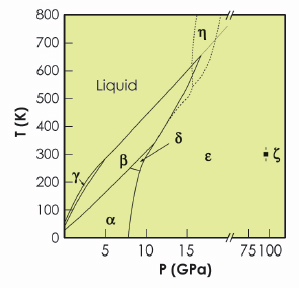
Solid oxygen is unique amongst the elements in being both molecular and magnetic. As a consequence, it has a rich and complex phase diagram (Figure 8) and numerous phases with unusual magnetic, thermal and optical properties [1]. Solid oxygen is the only elementary molecular magnet; it exhibits a number of complex magnetic phases; on compression it changes colour from pale-blue to light orange to dark red; and at pressures above 96 GPa it becomes a superconducting metal. The perceived highly-reactive nature of oxygen under high-temperature conditions, particularly in the liquid state, has limited most static high-pressure studies of oxygen to room or low temperatures. But recent studies of solid oxygen to temperatures as high as 1250 K have suggested the existence of a further new phase of oxygen, η-oxygen, existing just beneath the melting curve [2,3]. We investigated the structure of the η phase by using a diamond anvil pressure cell and high-temperature high-pressure single-crystal diffraction techniques on beamline ID09A.
 |
|
Fig. 8: The reported phase diagram of oxygen to 120 GPa and 800 K [1]. Note the break in the pressure axis at 20 GPa. The dotted extension to the melting line is that reported by Weck et al. [3], while the dashed lines show the phase boundaries proposed by Santoro et al. [2]. |
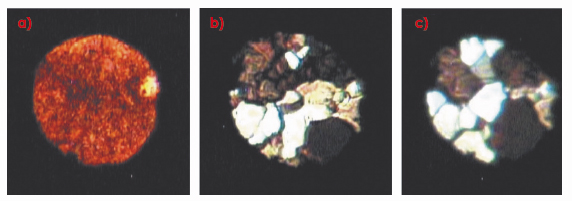
Figure 9a shows a micro-photograph of a polycrystalline sample of “red” e-oxygen at 18.1 GPa and 293 K, which, on heating to 675 K at the same pressure, anneals into a number of single crystals, which optical spectroscopy reveals to be a mixture of the e and h phases (Figure 9b). Further annealing at 16.6 GPa and 650 K, results in crystals of only h-oxygen (Figure 9c).
A high-quality single crystal of ![]() -oxygen suitable for diffraction experiments was grown in situ on beamline ID09A at 15.9 GPa and 625 K, just below the melting temperature at this pressure. From the positions of 43 reflections, the structure of η-oxygen was found to be hexagonal with lattice parameters a = 2.561(2) Å and c = 6.575(6) Å, with two molecules per unit cell. The intensities of a total of 66 individual reflections were measured, and analysis showed them to be consistent with spacegroups P63/mmc, P
-oxygen suitable for diffraction experiments was grown in situ on beamline ID09A at 15.9 GPa and 625 K, just below the melting temperature at this pressure. From the positions of 43 reflections, the structure of η-oxygen was found to be hexagonal with lattice parameters a = 2.561(2) Å and c = 6.575(6) Å, with two molecules per unit cell. The intensities of a total of 66 individual reflections were measured, and analysis showed them to be consistent with spacegroups P63/mmc, P![]() 2c and P63mc. Spacegroup P63/mmc is the same as that of the hexagonal close-packed (hcp) structure found in many elemental metals, while the c/a ratio of η-oxygen is very close to two thirds of that expected for rhombohedral ß-oxygen at 15.9 GPa, the structure of which comprises layers of aligned O2 molecules in a face centred cubic (fcc) like stacking sequence. All of this suggested a structural model for η-oxygen in which aligned O2 molecules are arranged in an hcp-like stacking, rather than the fcc-like stacking of ß-oxygen. Exactly the same structural model for η-oxygen can be constructed in space groups P
2c and P63mc. Spacegroup P63/mmc is the same as that of the hexagonal close-packed (hcp) structure found in many elemental metals, while the c/a ratio of η-oxygen is very close to two thirds of that expected for rhombohedral ß-oxygen at 15.9 GPa, the structure of which comprises layers of aligned O2 molecules in a face centred cubic (fcc) like stacking sequence. All of this suggested a structural model for η-oxygen in which aligned O2 molecules are arranged in an hcp-like stacking, rather than the fcc-like stacking of ß-oxygen. Exactly the same structural model for η-oxygen can be constructed in space groups P![]() 2c and P63mc. The fit of the data to this model is excellent.
2c and P63mc. The fit of the data to this model is excellent.
 |
|
Fig. 9: Microphotographs of a) polycrystalline |
The structure of η-oxygen is shown in Figure 10 and is closely related to the known high-pressure ![]() , ß,
, ß, ![]() , and
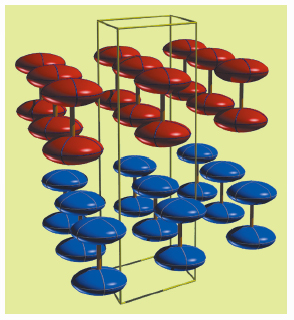
, and ![]() phases, particularly the rhombohedral ß phase. All of these high-pressure structures comprise sheets of O2 molecules in which the molecular axes are aligned parallel to each other. The h structure comprises two such layers of molecules, stacked alternately in an hcp-like ABAB arrangement along the c axis, while the ß structure comprises three such layers in an fcc-like ABCABC stacking. However, the packing of the dumbbell-shaped O2 molecules results in the symmetry of the ß phase being trigonal rather than cubic, with the rhombohedral angle being about 45° instead of 60° for the fcc structure.
phases, particularly the rhombohedral ß phase. All of these high-pressure structures comprise sheets of O2 molecules in which the molecular axes are aligned parallel to each other. The h structure comprises two such layers of molecules, stacked alternately in an hcp-like ABAB arrangement along the c axis, while the ß structure comprises three such layers in an fcc-like ABCABC stacking. However, the packing of the dumbbell-shaped O2 molecules results in the symmetry of the ß phase being trigonal rather than cubic, with the rhombohedral angle being about 45° instead of 60° for the fcc structure.
 |
|
Fig. 10: The structure of η-O2, showing the molecular layers that make up the structure. The two molecules within each unit cell are shown using different colours. The thermal ellipsoids are shown at the 90% probability level. |
While the study of η-oxygen confirmed its existence and determined its structure, we were unable to map out the stability range of this phase due to the failure of the diamonds in the pressure cell. Subsequent spectroscopic studies are planned. However, the present study illustrates the quality of single-crystal diffraction data that can now be collected at the ESRF from weakly-scattering samples such as oxygen, even at high temperatures and pressures. Such a capability bodes well for even more extreme studies in the future.
References
[1] Y.A. Freiman and H.J. Jodl, Phys. Reports 401, 1 (2004).
[2] M. Santoro, E. Gregoryanz, H.K. Mao and R.J. Hemley, Phys. Rev. Lett. 93, 265701 (2004).
[3] G. Weck, P. Loubeyre, J.H. Eggert, M. Mezouar and M. Hanfland, Phys. Rev. B 76, 054121 (2007).
Principal publication and authors
L.F. Lundegaard (a), C. Guillaume (a), M.I. McMahon (a), E. Gregoryanz (a), and M. Merlini (b), The Journal of Chemical Physics 130, 164516 (2009).
(a) The University of Edinburgh (UK)
(b) ESRF
partners


European Synchrotron Radiation Facility - 71, avenue des Martyrs, CS 40220, 38043 Grenoble Cedex 9, France.