- Home
- Scaling in the Time Domain - Universal Dynamics of Order Fluctuations in Fe3Al
Scaling in the Time Domain - Universal Dynamics of Order Fluctuations in Fe3Al
Solid state theory predicts that a material should respond ultra-sensitively to external perturbations (temperature, pressure, magnetic or electric fields), when it is close to a phase transition. This response is governed by microscopic fluctuations in the system: quantities like volume, entropy or sub-lattice order are strongly fluctuating for temperatures near the critical temperature TC. For continuous phase transitions, the correlation length (![]() ) in the system is diverging [1] when TC is approached. The mesoscopic size of fluctuating domains leads to universal macroscopic response functions – power laws involving critical exponents that depend only on the dimensionality and symmetry of the system. X-ray and neutron scattering experiments have led to a consistent picture of the static critical behaviour. However, since fluctuations exhibit a time structure, our picture of phase transformations is incomplete without understanding the microscopic fluctuations in the time domain.
) in the system is diverging [1] when TC is approached. The mesoscopic size of fluctuating domains leads to universal macroscopic response functions – power laws involving critical exponents that depend only on the dimensionality and symmetry of the system. X-ray and neutron scattering experiments have led to a consistent picture of the static critical behaviour. However, since fluctuations exhibit a time structure, our picture of phase transformations is incomplete without understanding the microscopic fluctuations in the time domain.
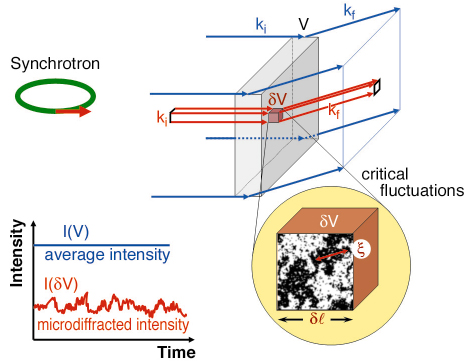
Recently the technique of X-ray intensity fluctuation spectroscopy has been developed, using coherent synchrotron X-ray beams: the diffracted intensity is a time-dependent “speckle pattern”, uniquely related to the spatial arrangement of the ordered domains in the sample [2]. This approach is strongly limited today by the low intensity in the coherent beam. In order to observe dynamic fluctuations on a microscopic scale we used a partially coherent focused X-ray beam (Figure 160) illuminating the sample which is kept close to TC. We record in real time intensity fluctuations of the diffracted beam, which are associated with the order fluctuations in the sample. Since a fully coherent beam is not required in this approach, the whole X-ray beam can be focused to a micrometre spot on the micrometre-thick sample. Thus, we reduce the probed volume to a few µm3 and also preserve the high number of incident photons.
 |
|
Fig. 160: Principle for a diffraction “microscope”: In a conventional diffraction experiment (large probed volume compared to |
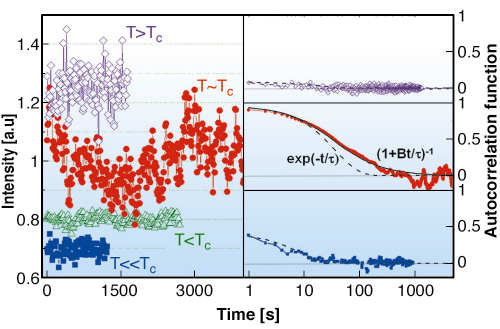
The experiment was carried out at the ID22 beamline using a focused beam slightly smaller than 2 x 2 µm2. The sample was a Fe3Al single crystal, in which the Fe and Al atoms order on a cubic lattice (chemical order). Upon increasing the temperature, the atoms are mobile enough to jump between sites, reducing the chemical order (crystalline order still preserved). We investigated the B2-A2 order-disorder transition in Fe3Al by recording (near Tc) the intensity of superstructure peaks. Upon increasing the temperature, the atoms are mobile enough to change sites and reduce the chemical order whereas the crystalline order is still preserved. Consequently the intensity of superstructure peaks diminishes and ultimately vanishes in the disordered state. Moreover, in the vicinity of TC the X-ray intensity exhibits fluctuations in time, fluctuations which are diverging at TC (shown in Figure 161 (left)). We have recorded in real time the X-ray intensity fluctuations close to TC, where both ordered and disordered domains exist. The associated fluctuating domain size is expected to diverge.
 |
|
Fig. 161: (left) Time-resolved diffraction intensities at temperatures near TC. The series are normalised to 1 then shifted vertically for the sake of clarity. (right) Correlation functions for different temperatures. Black lines are the fits using the algebraic forms: exponential decay (dotted line) and power law decay (continuous line). |
The autocorrelation functions of the measured intensities (Figure 161 (left)) are 4-point correlation functions. The theoretical analysis showed that the autocorrelation functions can be very well described in a simple form: an exponential decay at temperatures far from TC and a power law decay for T ≈ TC (Figure 161 (left)). The associated critical exponent is deduced and found to be in good agreement with the theoretical value (z ~ 2), demonstrating the universal character of the fluctuations in Fe3Al. The dynamics of the ordered domains was slow enough to be accessed in a time-frame of the order of a few seconds. The associated correlation times are surprisingly large (up to 70 seconds at T ≈ TC), many orders of magnitude larger than the characteristic microscopic time-scale (~10-7 seconds for the single jump of a Fe atom). The decay of the correlation function with a power law confirms scaling in the time domain.
Our results clearly indicate that incoherent focused microbeams can be used to study 4-point correlation functions and the dynamics of critical fluctuations in crystalline materials. The experimental results demonstrate directly the crossover from non-critical (T < TC) to critical (T ~ TC) dynamics in solid binary alloys. With the development of high brilliance micro- and nanobeams at synchrotron radiation and free electron laser facilities, such experiments will give access to other type of fluctuations, particularly for systems in confined geometries as they appear in thin films and nanosystems.
References
[1] M. E. Fisher, in Critical Phenomena, M. S. Green, Ed. (Academic Press, London, 1971).
[2] M. Sutton et al., Nature 352, 608 (1991).
Principal Publication and Authors
C. Mocuta (a,b), H. Reichert (a), K. Mecke (a), H. Dosch (a) and M. Drakopoulos (b), Science 308, 1287 (2005).
(a) Max-Planck-Institut für Metallforschung, Stuttgart (Germany)
(b) ESRF
partners


European Synchrotron Radiation Facility - 71, avenue des Martyrs, CS 40220, 38043 Grenoble Cedex 9, France.