- Home
- Users & Science
- Scientific Documentation
- ESRF Highlights
- ESRF Highlights 2001
- Surfaces, Interfaces and Nano-science
- Structure of the Clean NiAl(110) Surface and the Al2O3/NiAl(110) Interface
Structure of the Clean NiAl(110) Surface and the Al2O3/NiAl(110) Interface
Surfaces and interfaces possess properties that are important to a wide range of practical applications. Due to the abrupt changes in structure and bonding, a variety of new and sometimes unexpected physical phenomena are observed. Interfaces are buried and inaccessible to the majority of surface-sensitive techniques. However, because of the macroscopic penetration depth of X-rays, both surfaces and interfaces scatter in a similar way and give rise to diffraction features along the crystal truncation rods (CTR's) perpendicular to the surface. Here we report on grazing incident X-ray diffraction GID measurements for characterisation of the structure of the clean NiAl(110) surface and the Al2O3/NiAl(110) interface.
The experiments were carried out at beamline ID3. The clean NiAl(110) surface was prepared by repeated cycles of Ar+ sputtering and annealing. The surface quality was inferred from the CTR's widths along the reciprocal space H and K directions. The domain sizes ranged between 500 and 800 Å. The Al2O3/NiAl(110) sample was prepared by repeated cycles of oxygen doses on NiAl(110) at room temperature and subsequent annealing [1]. This procedure was repeated until there was no further increase in the intensity of the superstructure reflections from the oxide films and no further decrease in the angular width.
The measured CTR's were fitted by a least squares refinement using a model with four NiAl layers forming their respective surface cells. The best-fit procedure for the clean NiAl(110) surface was performed considering isotropic temperature dependence and a 1:1 compositional stoichiometry between Ni and Al as in the bulk. The results are shown schematically in Figure 62a. The topmost rippling amplitude obtained from this fit is RNi/Al = 0.16 ± 0.01 Å, which is significantly smaller than the value RNi/Al = 0.22 Å previously reported [2]. The topmost Al and Ni atoms move 4.6 % outwards and 3.4 % inwards, respectively. The dependence of the rippling amplitude with non-structural parameters, such as anisotropic vibrations or chemical disorder, was also carefully checked. It remains practically unchanged. The second, third and fourth atomic layers exhibit almost negligible relaxations.
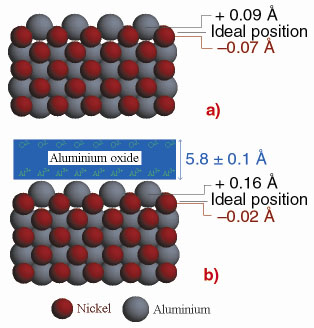 |
Fig. 62: Schematical side view projection of best-fit results for (a) the NiAl(110) surface and (b) the Al2O3/NiAl(110) interface, showing the rippling of the topmost surface layer. The atomic arrangement in the oxide structure has not yet been determined. |
An identical analysis was made for the Al2O3/NiAl(110) interface. Figure 63 shows schematically the results of the best-fit procedure for the (0,1), (1,0) and (1,1) measured CTRs. Due to the non-commensurability of the thin Al2O3 film with the substrate, the oxide unit cell could be omitted during the fit refinement procedure [1]. The resulting rippling amplitude of the topmost interface layer was RNi/Al = 0.18 ± 0.02 Å. In the topmost substrate layer, the Al atoms move 7 % outwards while Ni atoms move 2% inwards similar to the clean surface (Figure 62b). No preferential segregation into the surface was detected. The surface roughness did not increase with the formation of an oxide film. This rules out any reconstruction of the top substrate layer. The Al2O3/NiAl(110) interface appears to be atomically abrupt and on the alloy side terminated by Al. No enrichment of Ni could be detected in the X-ray structure analysis. This agrees with theoretical calculation [3], where the Al atoms are supplied by exchange of Ni and Al in the top layers and subsequent dissolution of Ni into the bulk by segregation of Ni vacancies. In order to study the thickness of the oxide layer and the projected electron density along the z-direction the extended reflectivity up to l = 3.8 has been measured. An oxide layer thickness of 5.8 ± 0.1 Å is obtained from best-fit procedure of the extended reflectivity (Figure 62b). This is in agreement with Al-O-bilayers sequences, with Al at the substrate side and O-termination at the vacuum side.
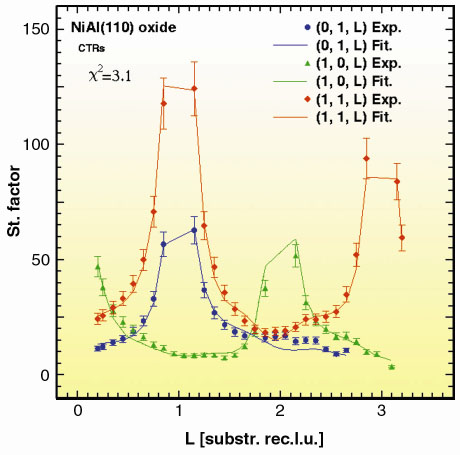 |
Fig. 63: Measured (0,1), (1,0) and (1,1) CTR's of the Al2O3/NiAl(110) interface. The lines are calculated curves from the results of the best-fit procedure. |
References
[1] R. Franchy, Surface Science Reports, 38, 195 (2000).
[2] H.L. Davis and J.R. Noonan, Phys. Rev. Lett., 54, 566 (1985).
[3] A.Y. Lozovoi, A. Alavi, and M.W. Finnis, Phys. Rev. Letters, 85, 610 (2000).
Principal Publication and Authors
X. Torrelles (a), F. Wendler(b), O. Bikondoa (c, d), H. Isern (c), W. Moritz(b) and G.R. Castro (c, d), Surface Science, 487, 97 (2001).
(a) Institut de Ciència de Materials de Barcelona, C.S.I.C., Bellaterra (Spain)
(b) Institut für Kristallographie und Angew. Mineralogie, Univ. München (Germany)
(a) SpLine, Spanish CRG Beamline, ESRF
(b) Instituto de Ciencia de Materiales de Madrid, C.S.I.C., Madrid (Spain)
partners


European Synchrotron Radiation Facility - 71, avenue des Martyrs, CS 40220, 38043 Grenoble Cedex 9, France.