- Home
- Figure 73
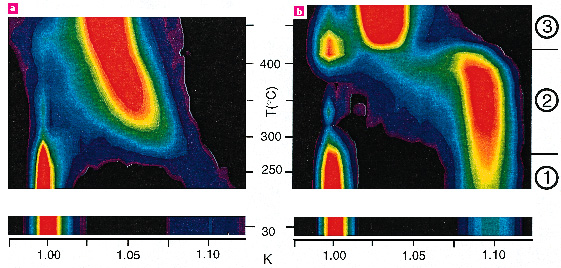
Figure 73
Fig. 73: Maps of the "kscans" as a function of the annealing temperature for (a) the 3 ML Co deposit and for (b) the 10 ML Co deposit; annealing temperature is the vertical axis, the reciprocal space reduced co-ordinate k is the horizontal axis and colour depends on the diffracted intensity; black is for the noise, and intensity increases from purple to red.
partners


European Synchrotron Radiation Facility - 71, avenue des Martyrs, CS 40220, 38043 Grenoble Cedex 9, France.