- Home
- Users & Science
- Scientific Documentation
- ESRF Highlights
- ESRF Highlights 2013
- Enabling technologies
- Better phase images with “messy” X-ray beams
Better phase images with “messy” X-ray beams
Although the development of X-ray optics has seen remarkable progress, technological constraints of fabrication processes are still limiting the quality and resolution of images obtained with X-ray lenses. In addition, traditional microscopy techniques based on these lenses are generally limited to absorption contrast and do not provide a means to extract valuable quantitative phase images of a sample. Lensless techniques overcome these limitations by replacing X-ray optics with a computer algorithm that reconstructs both the absorption and the phase shift produced by a sample. One of these techniques, ptychography [1], is used today with great success as a high-resolution extension to traditional scanning microscopy techniques. However, it may suffer from long acquisition times related to the scanning procedure, where only a small part of the sample is illuminated and the huge dynamic range required in the far-field diffraction patterns. Lensless full-field techniques such as inline holography are typically much faster since they illuminate the whole sample at once and can operate with detectors with a reduced dynamic range. However, such near-field propagation techniques can succeed only if the phase and intensity of the incoming beam are relatively uniform, since inhomogeneities in the incident wavefront mix with the sample in a non-trivial way.
A hybrid between ptychography and holography, near-field ptychography overcomes those limitations by intrinsically taking the distortions in the wavefront into account. To achieve this, a series of images is recorded where the object is moved to different lateral positions while the illumination with its distortions stays fixed. Besides the experimental parameters like energy and the setup geometry, the ptychographic phase-retrieval algorithm does not require any prior knowledge about the sample. It uses knowledge about the lateral positions to separate the sample cleanly from the (distorted) illumination in an iterative manner. The result is a quantitative image of the sample and also a quantitative image of the illumination.
 |
|
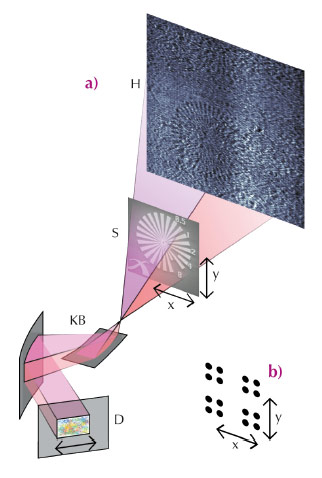
Fig. 141: Schematic of the experimental setup used for X-ray near-field ptychography. (a) X-rays from an undulator source (not depicted) are focussed by Kirkpatrick-Baez mirrors (KB) to record a magnified hologram (H) of the sample (S). A piece of cardboard, the so-called diffuser (D), can be placed into the beam to distort the wavefront. The sample mounted on a high-precision stage is moved as depicted in (b) transversally, where at each of the 16 positions a raw image is recorded. |
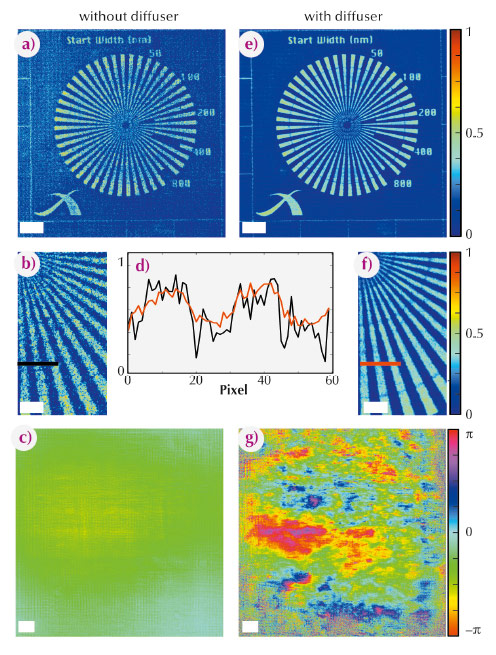
A first experimental demonstration of the technique was carried out at the nano imaging endstation of ID22 with the standard configuration for (magnified) holotomography [2], which is depicted in Figure 141. The sample consisted of a well-known test structure, a so-called “Siemens star”. The reconstructed images are shown in Figures 142a-c. Further, it was demonstrated that the quality of the image could be greatly improved when additional distortions are introduced in the illumination. Figures 142e-g show the reconstructed images obtained from a dataset recorded after a piece of cardboard, the so-called diffuser, was added in the beam path. The results are shown in Figures 142e-g. Near-field ptychography is a quantitative technique: the reconstructed phase shift of the X-ray wave caused by the test structure is in good agreement with theoretical expectations and other measurements.
 |
|
Fig. 142: Reconstructed images of the sample and the illumination. (b) a magnified region. (c) the phase of the illumination. (e) the sample with diffuser in the beam path. The illumination (g) now looks rather “messy”, however, the image quality has significantly increased (f), a comparison with (b) is shown in (d). The scale bars indicate 5 µm and 2 µm for the magnified regions of interest. Note that surrounding empty areas of the object were cropped. |
In combination with computed tomography, this approach has great potential for a quantitative visualisation at the nano scale, e.g. of samples from materials science research. Besides imaging applications, this approach can also be used to characterise optical elements. Moreover, it can also be transferred to optical light microscopy or electron microscopy.
Principal publication and authors
M. Stockmar (a), P. Cloetens (b), I. Zanette (a), B. Enders (a), M. Dierolf (a), F. Pfeiffer (a) and P. Thibault (a,c), Scientific Reports 3, 1927 (2013).
(a) Physics Department, Technische Universität München, Garching (Germany)
(b) ESRF, Grenoble (France)
(c) Current address: Physics & Astronomy Department, University College London (UK)
References
[1] M. Dierolf, A. Menzel, P. Thibault, P. Schneider, C.M. Kewish, R. Wepf and F. Pfeiffer, Nature 467, 436–439 (2010).
[2] R. Mokso, P. Cloetens, E. Maire, W. Ludwig and J.-Y. Buffiere, Applied Physics Letters 90, 144104 (2007).
partners


European Synchrotron Radiation Facility - 71, avenue des Martyrs, CS 40220, 38043 Grenoble Cedex 9, France.