- Home
- Users & Science
- Scientific Documentation
- ESRF Highlights
- ESRF Highlights 2006
- High Resolution and Resonance Scattering
- Coherent peaks and minimal probing depth in photoemission spectroscopy of Mott-Hubbard systems
Coherent peaks and minimal probing depth in photoemission spectroscopy of Mott-Hubbard systems
Transition metal oxides (TMO) form a series of compounds with a uniquely wide range of electronic properties, mostly driven by electron correlation effects. One remarkable example of the competition between itinerancy and correlation is the metal to insulator Mott transition (MIT). V2O3 undergoes a Mott transition as a function of both temperature and pressure, thus representing a paradigmatic case in TMO. Over the last decade, the dynamical mean field theory (DMFT) has successfully described the MIT in a unified approach [1]. However, one of its foremost predictions, the presence of coherent features at the Fermi energy EF, has only been identified very recently thanks to the increased bulk sensitivity obtained by photoemission spectroscopy (PES) in the soft X-ray regime [2]. In general, reliable comparisons between DMFT and PES data across the MIT are rare: this is mainly due to the lack of truly bulk-sensitive PES experiments.
We have performed hard X-ray PES (HAXPES, ![]() w ~ 5.95 keV) experiments on pure V2O3 single crystals using the VOLPE setup installed on beamline ID16 [3]. Thanks to the enhanced bulk sensitivity, we: i) obtained a quantitative measure of the electron correlation energy U, via comparison with LDA+DMFT calculations; ii) observed a clear relationship between the coherent peak measured near EF and the satellite features observed in the vanadium 2p core level spectra.
w ~ 5.95 keV) experiments on pure V2O3 single crystals using the VOLPE setup installed on beamline ID16 [3]. Thanks to the enhanced bulk sensitivity, we: i) obtained a quantitative measure of the electron correlation energy U, via comparison with LDA+DMFT calculations; ii) observed a clear relationship between the coherent peak measured near EF and the satellite features observed in the vanadium 2p core level spectra.
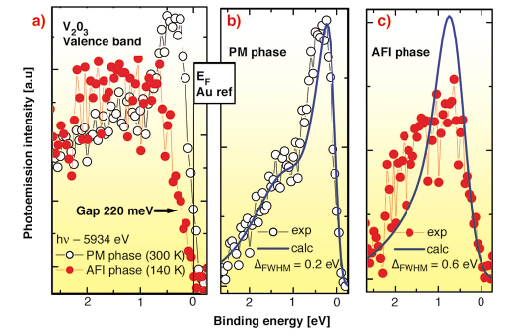
In Figure 1 we present valence band spectra compared to DMFT calculations. Raw data in panel a) show a well defined coherent peak at EF in the paramagnetic metallic (PM) phase, together with an incoherent band centred at around 1.5 eV binding energy. When crossing the MIT (140 K, antiferromagnetic insulating (AFI) phase), the coherent peak disappears and one observes the opening of a gap of 220 ± 20 meV. Calculations performed for various values of the parameter U, find that U = 4.2 eV provides the best simultaneous description of the various phases observed in V2O3. Large values of U result in the opening of another gap for the structure corresponding to the metallic phase. Panel (b) and (c) show PES spectra compared to LDA+DMFT calculations. In the metallic phase (panel b) the agreement is remarkably good, where the calculation matches simultaneously the ratio between coherent and incoherent parts as well as their location on the energy scale. In the insulating phase (panel c), calculations give the correct energy position of the intensity maximum but, even using an increased broadening (0.6 eV), the agreement remains qualitative. The experimental intensity spreads over a larger bandwidth than in the calculations. At present, we have no explanation for such difference.
 |
|
Fig. 1: Valence band spectra in the PM (white circles) and AFI (filled red circles) phase: a) Raw data with no background subtraction. The spectra reveal the complete disappearance of the coherent peak and the opening of a gap of 220 ± 20 meV in the AFI phase. Comparison with DMFT calculations for: b) the PM phase; and c) the AFI phase. Calculated lineshapes are convoluted with a Gaussian to match the leading edge of the experimental data. |
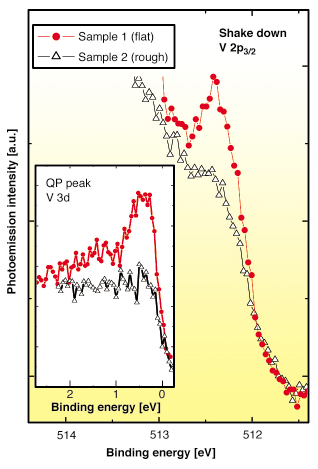
Figure 2 compares the intensity of the coherent quasiparticle peaks at EF (inset) and of the V 2p2/3 shake down satellite for two sample preparations (flat surface area and rough surface). We observe that the presence of the core level satellites is directly related to the valence band coherent peaks, and that macroscopic imperfections (sample 2) depress both the satellite intensity and the coherent intensity at EF.
 |
|
Fig. 2: Room temperature V 2p3/2 core-level and (inset) valence band for two different samples preparations: cleaved flat surface (red circles) and mechanically polished rough surface (open triangles). The spectra have been arbitrarily scaled by a multiplication factor for better comparison. |
Our results not only confirm the remarkable change of the screening properties in TMO when going from the surface to the volume, but open the way to the determination of important parameters such as the on-site Coulomb interaction via the combined analysis of core level and valence band PES spectra.
References
[1] A. Georges et al., Rev. Mod. Phys. 68, 13 (1996).
[2] S.–K. Mo et al., Phys. Rev. Lett. 90, 186403 (2003).
[3] P. Torelli et al., Rev. Sci. Instr. 76, 023909 (2005); M. Sacchi et al., Phys. Rev. B71 155117 (2005).
Principal Publication and Authors
G. Panaccione (a), M. Altarelli (b), A. Fondacaro (c), A. Georges (d), S. Huotari (c), P. Lacovig (e), A. Lichtenstein (f), P. Metcalf (g), G. Monaco (c), F. Offi (h), L. Paolasini (c), A. Poteryaev (d), O.Tjernberg (k), M. Sacchi (i), Phys. Rev. Lett. 97, 116401 (2006).
(a) TASC Laboratory, INFM - CNR, Trieste (Italy)
(b) European XFEL Project c/o DESY, Hamburg (Germany)
(c) ESRF
(d) Ecole Polytechnique, Palaiseau (France)
(e) Sincrotrone Trieste (Italy)
(f) Inst. für Theoretische Physik, Univ. Hamburg (Germany)
(g) Dep. of Chemistry, Purdue University, West Lafayette (USA)
(h) Dip. di Fisica Univ. Roma III (Italy)
(k) LMSP, Royal Institute of Technology, Kista (Sweden)
(i) LCP-MR, Univ. P. et M. Curie, Paris, and Synchrotron SOLEIL, Gif-sur-Yvette (France)
partners


European Synchrotron Radiation Facility - 71, avenue des Martyrs, CS 40220, 38043 Grenoble Cedex 9, France.