- Home
- Users & Science
- Scientific Documentation
- ESRF Highlights
- ESRF Highlights 2006
- Soft Condensed Matter
- Microdiffraction on A-amylose single crystals
Microdiffraction on A-amylose single crystals
The difficulty in obtaining sufficiently large single crystals usually limits polymer and biopolymer studies to X-ray powder and fibre diffraction methods. Until recently, this was also the case for the polysaccharide amylose. Amylose is a linear molecule of (1-4)-linked ![]() -D-glucopyranosyl units and is found in native starch granules. Progress in synchrotron radiation microdiffraction and crystal growth techniques has now allowed the study of micrometre-sized A-amylose crystals by single crystal diffraction methods.
-D-glucopyranosyl units and is found in native starch granules. Progress in synchrotron radiation microdiffraction and crystal growth techniques has now allowed the study of micrometre-sized A-amylose crystals by single crystal diffraction methods.
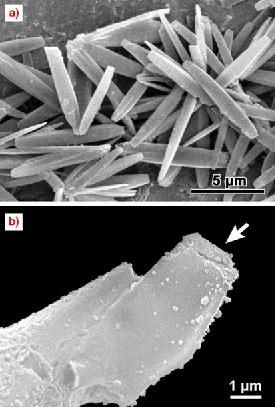
A typical aggregate of needle-shaped A-amylose microcrystals is shown in Figure 54a [1]. Micromanipulation techniques developed at the ID13 beamline allowed the selection and mounting of individual crystals from such an aggregate. A SEM image of a typical crystal glued to a glass capillary is shown in Figure 54b. The two crystals studied were rotated in steps of 20 and 40 with 1 and 2 second exposure time per step, respectively. The highest resolution obtained was 1.51 Å.
 |
|
Fig. 54: a) SEM image of A-type amylose crystal aggregate; b) SEM image of an air-dried amylose single crystal glued to a borosilicate glass capillary tip. The small ripples on the glass capillary are due to glue. |
In previous structural analysis by an electron diffraction method and from packing considerations [2], a clear-cut difference between orthorhombic and monoclinic symmetries could not be firmly established for A-amylose. The present X-ray microdiffraction data allows the analysis of a large set of symmetry equivalent and statistically significant reflections. This allowed testing for the best space group by using the XDS program package, which clearly established the monoclinic symmetry for A-amylose. The space group B2 was chosen as equally possible space groups Bm and B2/m can be excluded on the basis of optical activity of A-amylose.
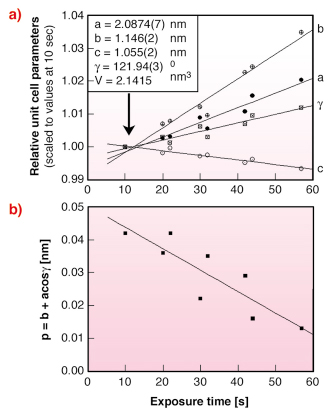
A systematic change of unit cell parameters was observed with increasing X-ray exposure at 100 K (Figure 55a). It is also interesting to note that the monoclinic unit cell gets closer to a pseudo-orthorhombic cell with increasing dose (Figure 55b). This phenomenon can be described using the parameter p = b + acos![]() , which becomes 0 for a pseudo-orthorhombic lattice. Here a/b and
, which becomes 0 for a pseudo-orthorhombic lattice. Here a/b and ![]() are the refined monoclinic unit cell parameters.
are the refined monoclinic unit cell parameters.
Progress in data collection and structural analysis has recently allowed us to solve the A-amylose structure using a molecular replacement technique and its refinement for data, achieving a highest resolution of 1.2 Å [3].
 |
|
Fig. 55: a) variation of relative unit cell parameters with exposure time. Data were scaled to the unit cell parameters refined at the shortest exposure time (10 sec); b) variation of the parameter p = b + acos |
References
[1] G. Potocki-Veronese et al., Biomacromolecules 6(2), 1000-1011 (2005).
[2] A. Imberty, H. Chanzy, S. Pérez, A. Buléon, & Tran, J. Mol. Biol. 201,. 365-378 (1988).
[3] D. Popov et al., to be published.
Principal Publication and Authors
D. Popov, (a), M. Burghammer, (a), A. Buléon (b); N. Montesanti (c); J. L. Puteaux (c); C. Riekel (a), Macromolecules 16, 3704-3706 (2006).
(a) ESRF
(b) INRA, Nantes (France)
(c) CERMAV, Grenoble (France)
partners


European Synchrotron Radiation Facility - 71, avenue des Martyrs, CS 40220, 38043 Grenoble Cedex 9, France.