- Home
- Users & Science
- Scientific Documentation
- ESRF Highlights
- ESRF Highlights 2001
- Materials
- In situ, High-energy X-ray Diffraction Studies of Electrode Materials for Li-ion Batteries
In situ, High-energy X-ray Diffraction Studies of Electrode Materials for Li-ion Batteries
Li-ion batteries are the most common rechargeable power supply for portable electronic devices. Their electrode active materials, defined as "intercalation compounds", are capable of reversibly inserting (de-inserting) lithium ions in their crystalline structure upon reduction (oxidation). To understand the reason for their capacity to fade upon charge-discharge cycling, a deeper knowledge of their structural changes is required. The method to observe these changes is usually the time-resolved in situ X-ray diffraction carried out during the cycles. The main obstacle for such investigations is the large X-ray absorption of cell walls and electrolytic solution. Additionally, the sample itself produces rather weak diffraction signals even when synchrotron radiation is used as the primary beam.
In these experiments the very high-energy X-ray beam (87.5 keV) available at ID15B was utilised, reaching an extremely small attenuation (<1%) of the beam through the cell. The data collection was carried out by using an image plate detector (model MAR 345), which allows a complete collection of the Debye-Scherrer rings, which further improved the counting statistics. Furthermore, the high-energy of the beam guaranteed a good angular resolution despite the grazing-incidence geometry (Figure 129) required for the experiment. Indeed, if the radiation energy is increased, the Bragg reflections are produced at lower angles. Therefore, to keep the q-range unchanged, the detector must be moved away from the sample. As a consequence, the X-ray beam spot on the sample will appear smaller when seen from the detector and the Fraunhofer diffraction condition (point-like sample) is approached.
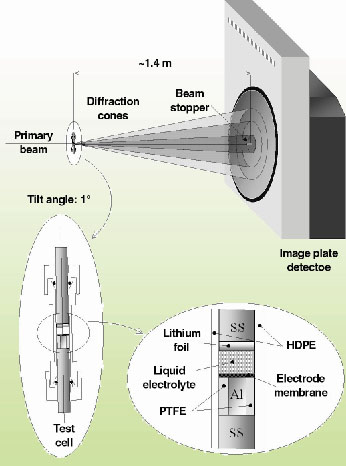 |
Fig. 129: Sketch of the test cell and of the experimental setup. |
These favorable conditions enabled real-time measurement of the lattice parameter a variation of the spinel Li4/3Ti5/3O4, usually defined as "zero-strain" compound because of the extremely small changes (![]() a/a<1o/oo) it exhibits when used as an anode material. Such a high structural stability is considered as the main reason for the long cycle life of this compound.
a/a<1o/oo) it exhibits when used as an anode material. Such a high structural stability is considered as the main reason for the long cycle life of this compound.
Figures 130a and 130b represent two intermediate stages of data processing. They show that even minimal systematic effects induced by the X-ray beam cannot be neglected when very accurate measurements are necessary. In Figure 130a, the time evolution of the a parameter is shown when neither the thermal drift of the monochromator, which induces a progressive shift of the beam energy, nor the slight vertical movement of the X-ray beam upon storage ring refilling are taken into account. In Figure 130b, the data are corrected for the first effect only; in Figure 130c for both.
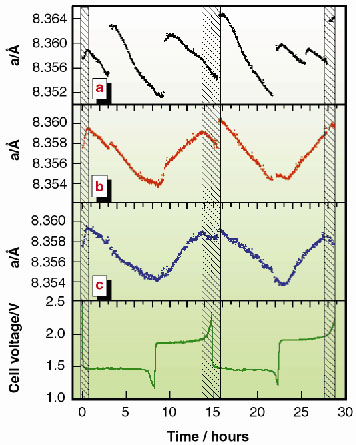 |
Fig. 130: Progressive refinement of experimental data (a and b) to obtain the final curve (c) of the time evolution of the lattice parameter a of Li4/3Ti5/3O4 (see text). The trend of the c curve clearly follows the cell voltage profile reported below. Shaded areas represent the intervals in which a unique phase is present; elsewhere a coexistence of two phases occurs. |
The result reported in the latter figure shows that Li4/3Ti5/3O4, commonly considered as an almost ideal material, undergoes structural variations qualitatively similar to other common electrode materials, although on a much smaller scale. The high sampling rate permitted the first observation of a trend variation the Li4/3Ti5/3O4 a curve, which can be attributed to the presence of single-phase (shaded areas) and bi-phase domains.
The high statistics and high frequency sampling also allowed us to accurately follow the real time changes of the well-known LiNi0.8Co0.2O2 cathode material, in order to observe its phase transitions upon cycling.
In Figure 131, two regions of the collected diffraction pattern sequence are shown. The peak evolution in the (4.2-4.8) Å-1 q-range during the first 14 hours of the cell working (Figure 131a) clearly reveals an irreversible transition between the two hexagonal (both R![]() m ) phases, H1 and H2, occurring during the first charge. Another region, corresponding to the (3.25-4.3) Å-1 q-range and to the whole experiment duration, is reported in Figure 131b. In this case, a second reversible phase transition from R
m ) phases, H1 and H2, occurring during the first charge. Another region, corresponding to the (3.25-4.3) Å-1 q-range and to the whole experiment duration, is reported in Figure 131b. In this case, a second reversible phase transition from R![]() m (H2) to P
m (H2) to P![]() m1 (H3) is observed at very high cell voltage.
m1 (H3) is observed at very high cell voltage.
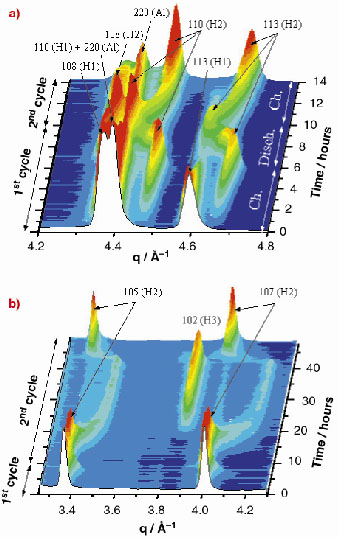 |
Fig. 131: Two regions in which an irreversible (a) and a reversible (b) phase transition in LiNi00.8Co0.2O2 can be observed. The former is revealed by the final disappearance of the 113(H1) peak; the latter, by the disappearance and reappearance of the 105(H2) and 107(H2) peaks. Peaks labelled with (Al) are produced by diffraction of the aluminum substrate. |
Principal Publications and Authors
V. Rossi Albertini (a), P. Perfetti (a), F. Ronci (b), P. Reale (b) and B. Scrosati (b), Appl. Phys. Lett., 79(1), 27, (2001); F. Ronci, P. Reale, S. Panero (b), B. Scrosati, V. Rossi Albertini, P. Perfetti, M. di Michiel (c) and J. Merino (c), J. Phys.-Chem. B, in press.
(a) Istituto di Struttura della Materia-CNR, Rome (Italy)
(b) University of Rome "La Sapienza" (Italy)
(c) ESRF
partners


European Synchrotron Radiation Facility - 71, avenue des Martyrs, CS 40220, 38043 Grenoble Cedex 9, France.