- Home
- Users & Science
- Scientific Documentation
- ESRF Highlights
- ESRF Highlights 2001
- Collective Atom Dynamics
- Characterisation of Surface Acoustic Wave Fields by High-resolution X-ray Diffraction
Characterisation of Surface Acoustic Wave Fields by High-resolution X-ray Diffraction
Electronic devices based on surface acoustic waves (SAW) are widely used today in modern communication systems (mobile phones, TV, GPS, radars, etc.). This development is accompanied by an increasing need for a precise characterisation of the acoustic fields in these devices, especially if higher frequency ranges above 1 GHz are to be reached. In this respect, high-resolution X-ray diffraction provides a unique tool: the propagation of a specific SAW, a Rayleigh wave, induces a sinusoidal modulation of the atomic planes at the surface of a crystal which extends into the bulk (Figure 87). This leads to X-ray diffraction satellites whose pattern and intensities can be compared with a model, allowing the retrieval of important parameters of the SAW, such as the acoustic amplitude at the surface, H0, the penetration depth of the acoustic wave, µac-1, and the acoustic wave vector K.
 |
Fig. 87: Scheme of the atomic planes distorted by the acoustic wave. The z scale is multiplied by a factor 104 with respect to the x one. Only a few planes are represented. |
A systematic study of X-ray diffraction by SAWs in a LiNbO3 crystal was carried out on the optics beamline BM5, varying the acoustic amplitude, the acoustic wavelength ![]() , the crystal cut and the X-ray energy. Triple-axis diffractometry was required to separate diffraction satellite peaks induced by the acoustic wave periodicity from the "ordinary" Bragg reflection. Figure 88 shows two typical rocking curves of a LiNbO3 (030) YX-cut crystal recorded at a fixed X-ray energy of 13 keV,
, the crystal cut and the X-ray energy. Triple-axis diffractometry was required to separate diffraction satellite peaks induced by the acoustic wave periodicity from the "ordinary" Bragg reflection. Figure 88 shows two typical rocking curves of a LiNbO3 (030) YX-cut crystal recorded at a fixed X-ray energy of 13 keV, ![]() = 12 µm, and acoustic amplitudes of 1.0 Å and 2.4 Å, respectively.
= 12 µm, and acoustic amplitudes of 1.0 Å and 2.4 Å, respectively.
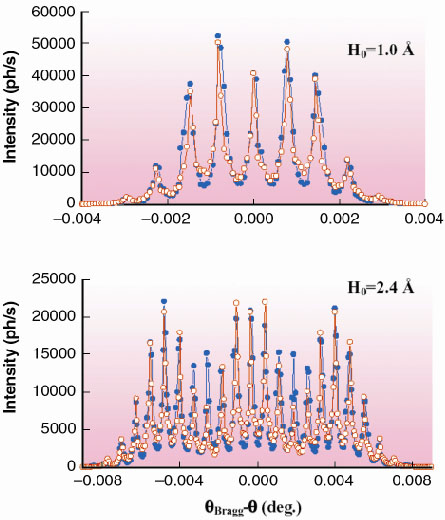 |
Fig. 88: Rocking curves measured (solid circles) and calculated (open circles) for two acoustic amplitudes. E = 13 keV; |
In order to interpret the spectra, we developed a simple model within the framework of kinematic X-ray diffraction theory, in which the SAW is treated as a strong perturbation, suppressing the dynamical X-ray diffraction properties of a perfect single crystal. Assuming an exponential damping of the acoustic amplitude along z, the vertical displacements of atoms with coordinates (x,y,z) can be written as: H(x,z) = H0exp(-µacz)exp(-iKx), where K = 2![]() /
/![]() , and µac-1 is of the order of the acoustic wavelength, i.e. a few micrometres. This model is expected to provide a correct quantitative description as long as the ratio between the acoustic and the X-ray penetration depth, µx-1, is higher than 1. This condition is fulfilled for the spectra shown in Figure 88, as can be seen from the good agreement between experiment and model calculation.
, and µac-1 is of the order of the acoustic wavelength, i.e. a few micrometres. This model is expected to provide a correct quantitative description as long as the ratio between the acoustic and the X-ray penetration depth, µx-1, is higher than 1. This condition is fulfilled for the spectra shown in Figure 88, as can be seen from the good agreement between experiment and model calculation.
If, on the other hand, the X-ray beam penetration is larger than the excited layer thickness, the kinematic model fails, since a significant amount of the undistorted crystal volume contributes to the diffraction pattern. This is demonstrated in Figure 89 where two rocking curves recorded at 18 and 20 keV, straddling the Nb K edge, are displayed. Due to the large contribution of undistorted regions at 18 keV (high X-ray penetration depth µx-1 ~ 25.6 µm), the 0th order peak, arising from diffraction of the perfect (unperturbed) crystal lattice, is predominant, while in the opposite case (E = 20 keV, µx-1 ~ 4.6 µm), the 0th order peak remains at the same level as the other ones. In the latter case, the kinematic model is still valid (as for the spectra reported in Figure 88), while in the first case, dynamical diffraction effects have to be taken into account. The development of such a refined model is currently in progress.
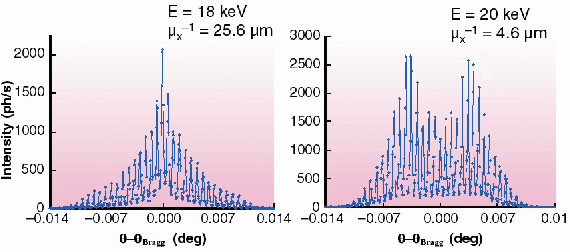 |
Fig. 89: Rocking curves measured at 18 and 20 keV. |
Principal Publication and Authors
R. Tucoulou (b, c), F. de Bergevin (b), O. Mathon (c) and D.V. Roshchupkin (b), Phys. Rev. B 64, 134108 (2001).
(a) Laboratoire de Cristallographie, CNRS, Grenoble (France)
(b) Institute of Microelectronic Technology, Russian Academy of Sciences, Chernogolovka (Russia)
(c) ESRF
partners


European Synchrotron Radiation Facility - 71, avenue des Martyrs, CS 40220, 38043 Grenoble Cedex 9, France.