- Home
- Users & Science
- Find a beamline
- ID28 - Inelastic Scattering II
- Energy Scans
Energy Scans
In backscattering geometry it is not possible to change the relative energy between monochromator and analyzer crystals by changing the Bragg angles: the energy variation would be small and the loss in energy resolution large. In order to overcome this difficulty the energy scans are performed by varying the temperature of one of the two crystals, which results in a change of their relative d-spacing.
The variation is given by:
![]() d/d =
d/d = ![]() (T)
(T) ![]() T ,
T ,
where ![]() is the coefficient of thermal expansion, and
is the coefficient of thermal expansion, and ![]() T is the temperature difference between the two crystals. In silicon around room temperture [1, 2] :
T is the temperature difference between the two crystals. In silicon around room temperture [1, 2] :
![]() (T) =
(T) = ![]() 0 +
0 + ![]() T,
T,
with ![]() 0 = (2.581 ± 0.002) x 10-6 K-1,
0 = (2.581 ± 0.002) x 10-6 K-1, ![]() = (0.016 ± 0.004) x 10-6 K-2 and T measured in K.
= (0.016 ± 0.004) x 10-6 K-2 and T measured in K.
According to the Bragg’s law E=hc/2d sin![]() B, and therefore, at fixed
B, and therefore, at fixed ![]() B:
B:
![]() E/E =
E/E = ![]() d/d = -
d/d = - ![]() (T)
(T) ![]() T ,
T ,
Considering the value of ![]() ~ 10-6, and the necessary resolving power
~ 10-6, and the necessary resolving power ![]() E/E ~ 10-7
E/E ~ 10-7 ![]() 10-8 , the temperature of the monochromator and the analyzer crystal has to be controlled with mK precision.
10-8 , the temperature of the monochromator and the analyzer crystal has to be controlled with mK precision.
For practical reasons is better to scan the temperature of the monochromator crystal and to keep constant the temperature of the analyzer crystal (close to ambient temperature).
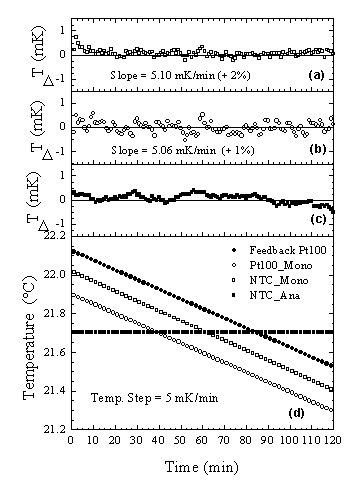
The linearity of the temperature scan, over the investigated temperature range, is a very important issue, because it allows to measure the same interval at each step. The linear behaviour of the most important thermometers, in a typical scan, is shown in the figure.

Typical monochromator temperature scan with a step of 5 mK/min. In (d) the most important thermometers (see temperature control page) are plotted as a function of time: (![]() ) feedback Pt100 Thermometer placed on the copper plate; (o) Pt100 and (
) feedback Pt100 Thermometer placed on the copper plate; (o) Pt100 and (![]() ) NTC thermometers placed in a small hole inside the silicon crystal; (
) NTC thermometers placed in a small hole inside the silicon crystal; (![]() ) NTC thermometer placed on the analyzer crystal. In (d) the temperature ramps were shifted in temperature to better observe the linearity. Panel (a) and (b) show the temperature differences from a linear temperature slope, panel (c) displays the temperature difference from the analyzer temperature setpoint.
) NTC thermometer placed on the analyzer crystal. In (d) the temperature ramps were shifted in temperature to better observe the linearity. Panel (a) and (b) show the temperature differences from a linear temperature slope, panel (c) displays the temperature difference from the analyzer temperature setpoint.
[1] A. Bergamin, G. Cavagnero, G. Mana, G. Tosi, European Physical Journal B 9, 225 (1999).
[2] A. Bergamin, G. Cavagnero, G. Mana, G. Tosi, J. Appl. Phys. 82, 5396 (1997).


