- Home
- News
- General News
- First full 3D view...
First full 3D view of cracks growing in steel
17-07-2008
PRESS RELEASE - A team of researchers from the University of Manchester, the National Institute of Applied Sciences (INSA) in Lyon (France) and the ESRF has revealed how a growing crack interacts with the 3D crystal structure of stainless steel. By using a new grain mapping technique it was possible to determine the internal 3D structure of the material without destroying the sample. Afterwards, a crack was initiated in the stainless steel, and the scientists were able to study how the crack grew between the grains. This is the first time that such an experiment has used the 3D grain mapping technique, and the first results are published in the journal Science this week.
Share
Cracks can appear in stainless steel components when stress or strain is combined with a corrosive environment that attacks sensitive grain boundaries. These cracks represent a critical failure mechanism. In power generation plants, certain grain boundaries can become sensitive during heat treatments or during fast neutron irradiation in nuclear power stations.
 |
||
 |
||
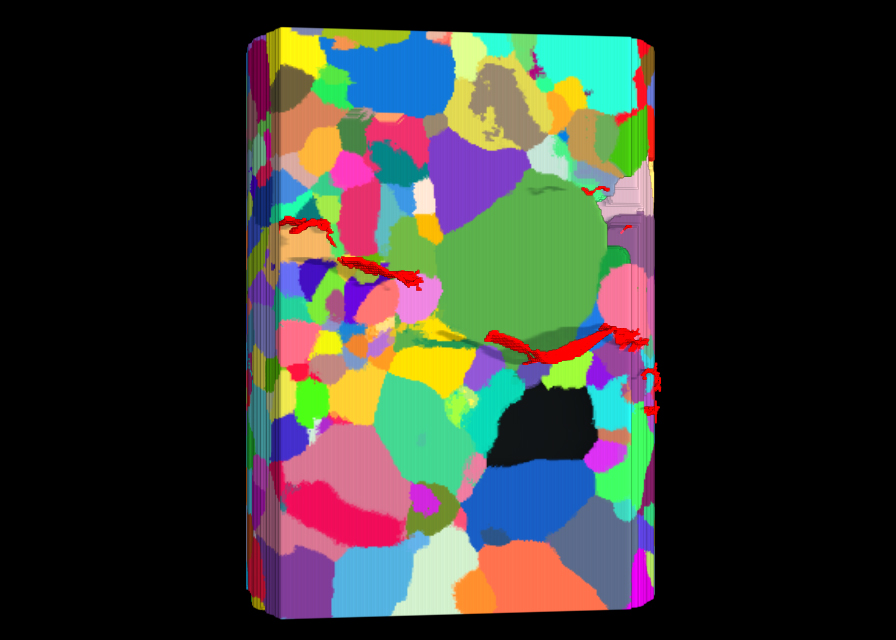 |
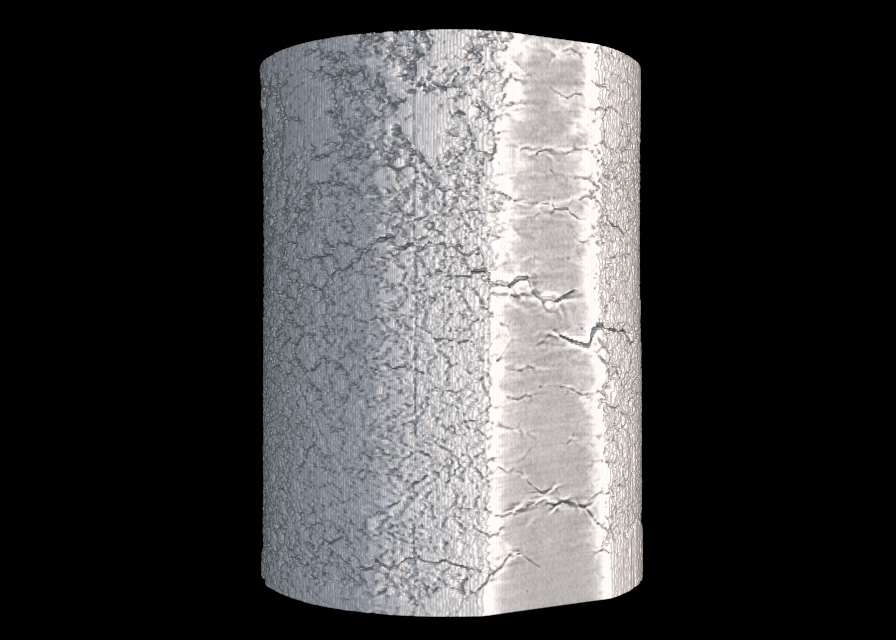
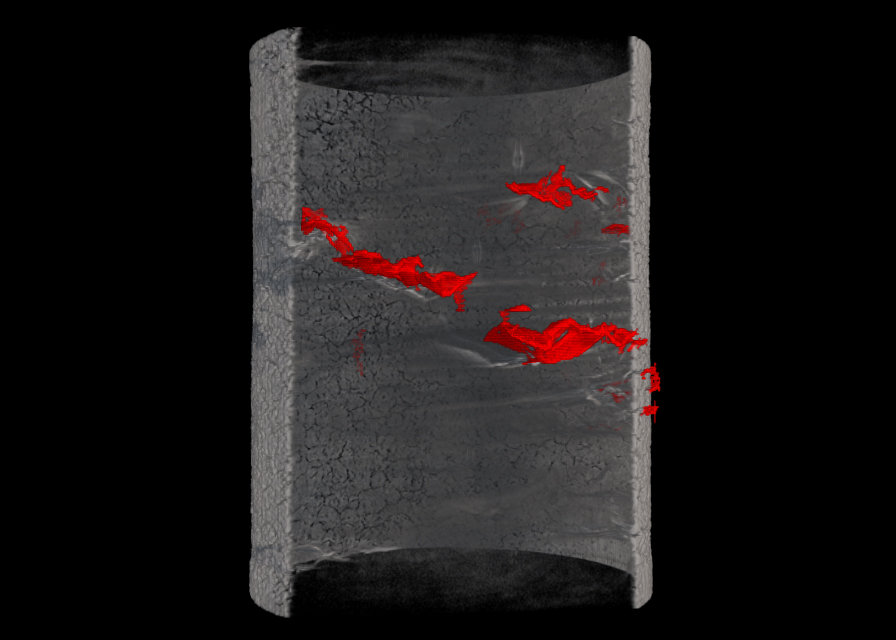
Different visions of the cracks forming in a stainless steel wire. In the first image, the sample is visible, as well as some cracks. In the middle one, the cracks inside are coloured red, and the last picture shows the different grains that make the wire, as well as the crack, superimposed, in red, that starts to form following grain boundaries. Credits: Andrew King. MOVIES ARE AVAILABLE AT THE END OF THIS PAGE.
Most metals used for engineering are made up of many small crystals or grains. The scientists used a new technique called diffraction contrast tomography, developed at the ESRF, to obtain a 3D map of all grains in a section of a stainless steel wire measuring 0.4 mm in diameter. This map contained the shapes, positions, and orientations of 362 different grains. The next stage of the experiment involved putting the wire into a suitable corrosive liquid, and applying a load to cause microcracks to grow between grains. During the crack growth, 3D tomographic scans (of 30 minutes each) were made at intervals of between two hours and a few minutes to follow the progress of the crack. This is the first in-situ experiment of this kind to use non-destructive 3D grain mapping techniques.
“The cracks grew along the boundaries between the grains which we had mapped in 3D, and we could visualize both the growing crack and certain special boundaries that resist cracking”, explains Andrew King, corresponding author of the paper in Science. “Some of these resistant boundaries were not the ones that we expected".
The special, crack-resistant boundaries may be of key importance to the metallurgy industry. Materials containing more of these boundaries are also more resistant to this type of cracking. Being able to study crack growth in-situ will allow scientists to understand what types of grain structures will give the best performing materials, leading, for example, to more efficient and safer power plants, and more generally to more lightweight alloys in other sectors of metallurgy and engineering.
Reference:
King, A. et al, Science, 18 July 2008.
For more information, please contact Montserrat Capellas, press officer, at +33 476 88 26 63 or e-mail
IMAGES AND VIDEOS
Images:
Sample and cracks
image1.tif
image1.jpg
Sample surface with cracks coloured red
Grain map with crack superimposed, showing crack followign grain boundaries
Videos:
Surface of the wire - some of the cracks on the surface are already visible, although still small at this point.
Cutting away the sample to show the the crack inside the wire
Fading in the grain map, to show the grain structure of the sample
The sample, now transparent, with the crack shown in red. Then the grain map appears, and it can be seen that the crack follows the boundaries between the grains.
partners


European Synchrotron Radiation Facility - 71, avenue des Martyrs, CS 40220, 38043 Grenoble Cedex 9, France.