- Home
- Users & Science
- Scientific Documentation
- ESRF Highlights
- ESRF Highlights 2017
- Complex systems and biomedical sciences
- Beating heart efficiency revealed by X-rays
Beating heart efficiency revealed by X-rays
The heart pumps blood through the vessels while keeping the pulmonary and systemic circulatory systems in balance. At the molecular level, this balance is contributed to by mechanosensing in the myosin filaments that recruit myosin motors in proportion to the load.
In the heart, a regulatory mechanism known as the Frank-Starling Law allows the pressure developed by the ventricle wall during the contraction phase (systole) to be adjusted with respect to its filling during the preceding relaxation phase (diastole). This ensures the balance between the pulmonary and systemic circulatory systems working in series. At the level of the cardiac cell (myocyte), this mechanism implies that the contractile force increases with the increase in the length of the sarcomere, the 2 µm-long structural unit. Within the sacomere, two arrays of myosin motors extending from the thick filament generate force pulling the interdigitating thin actin-containing filaments towards the centre.
In this work, the Frank-Starling law is shown to be contributed to at the molecular level by a mechanosensing-based regulation of thick filament activation. In the resting state, the myosin motors lie in their off state on the surface of the thick filament, unable to attach to the thin filament and split ATP. During contraction, the number of motors leaving the off state is adjusted to the force required to pump blood into the aorta or the pulmonary artery by mechanosensing in the thick filament. In this way, the energetic cost of the contraction is tuned to the mechanical task [1].
 |
|
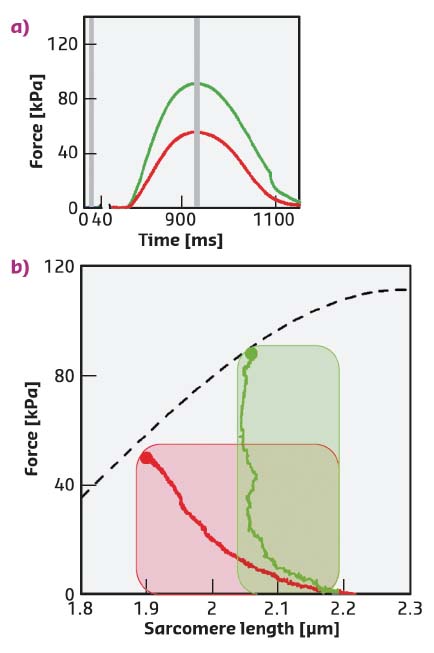
Fig. 50: a) Force of the FE (red) and LC (green) twitches. Stimulus starts at 775 ms. Grey bars: X-ray time windows. b) Relation between the peak force and the sarcomere length (dashed line) superimposed on the instantaneous force-sarcomere length plots for twitches in FE (red) and in LC (green). Filled circles, peak force. The shaded areas are the two ideal loops followed by contractions that start at sarcomere length ~2.2 µm under isometric condition and become isotonic when the force attains the same level as the twitch peak. In terms of the left ventricle beat, the dashed line is the relation between end-systolic pressure and end-systolic volume and the dashed areas are two pressure-volume loops starting from the same preload (i.e. end-diastolic volume) and with two different aortic pressures. |
Intact trabeculae, pillars of myocytes 2-3 mm in length, were mounted between force and length transducers at beamline ID02 to record the mechanical responses (twitches) and the X-ray diffraction signals during electrically paced contraction-relaxation cycles at different sarcomere lengths (Figure 50a, b). The USAXS/SAXS combination made it feasible to record, from the same trabecula, the nanometre-scale signals from the contractile proteins along the myosin and actin filaments together with the micrometre-scale changes in the length of the sarcomeres (Figure 51a-d).
 |
|
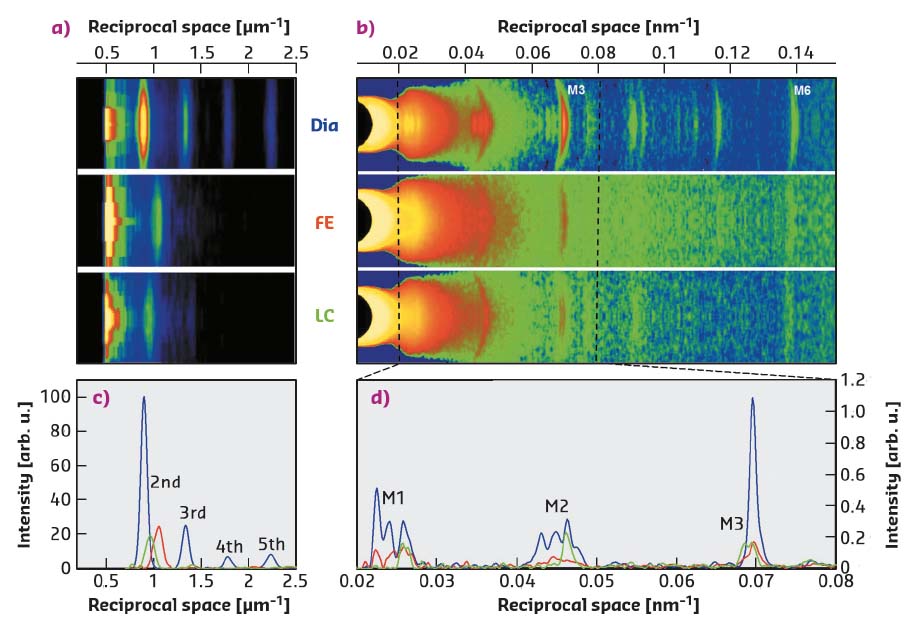
Fig. 51: a) Meridional slices of 2D X-ray patterns collected at 30 m during diastole (Dia) and at the peak force of a FE or LC twitch, showing the first orders of sarcomeric reflections. b) Meridional slices of 2D patterns, collected at 1.6 m, showing the myosin-based axial reflections (M1-M6). c) Superimposed intensity profiles from (a), starting from the second-order reflection. d) Superimposed intensity profiles from the region of (b) indicated by the dashed lines. |
During force development in a twitch under fixed-end conditions (FE), sarcomeres shorten against the end compliance so that, at peak force, the sarcomere length is reduced from the starting value of 2.21 µm (Dia, Figure 51a, c, blue) to 1.9 µm (red). Shortening during the following twitch can be largely prevented (length clamp conditions, LC) by a feedforward signal proportional to the shortening in the preceding FE twitch, so that, at peak force, the sarcomere length is 2.09 µm (green) and the force is almost twice the FE value (Figure 50a, b).
The myosin-based X-ray reflections marking the quasi-helical three-stranded symmetry of the myosin molecules on the thick filament are intense in diastole (Dia, Figure 51b, d, blue) This indicates that the myosin motors lie in helical tracks on the surface of the thick filament in their off state, in which they are unable to attach to actin and split ATP. At the peak of the twitch force (red and green), the intensities of the reflections decrease, due to the myosin motors leaving their helical tracks as the thick filament switches on. The M3 reflection, originating from the axial repeat of the myosin motors, exhibits a different fine structure and different increase in spacing depending on whether the contraction occurs in FE (Figure 51b, d red) or in LC (green). In terms of the structural model of the sarcomere [2], the difference in the M3 intensity profiles indicates that, during a cardiac twitch, only a fraction of the motors leaves the off state and this fraction depends on the level of the force independently of the diastolic sarcomere length. In this respect, the LC and FE twitches approximate the conditions of the left ventricle beating against a high (LC) and a low (FE) aortic pressure (Figure 50b).
This work provides a new integrated view of the Frank-Starling mechanism, which combines mechanical, structural and energetic aspects: independent of the end-diastolic sarcomere length (end-diastolic volume), the energetic cost of the heart beat is tuned to the ventricular end-systolic pressure-volume relation by stress-sensing in the thick filament.
Principal publication and authors
Myosin filament activation in the heart is tuned to the mechanical task, M. Reconditi (a,b), M. Caremani (a), F. Pinzauti (a), J.D. Powers (a), T. Narayanan (c), G.J.M. Stienen (d), M. Linari (a,b), V. Lombardi (a) and G. Piazzesi (a), PNAS 114, 3240-3245 (2017); doi: 10.1073/pnas.1619484114.
(a) PhysioLab, University of Florence (Italy)
(b) Consorzio Nazionale Interuniversitario per le Scienze Fisiche della Materia, Unità di Ricerca di Firenze, Florence (Italy)
(c) ESRF
(d) Department of Physiology, VU University Medical Center, Amsterdam (The Netherlands)
References
[1] M. Linari et al., Nature 528, 276-279 (2015).
[2] M. Reconditi et al., PNAS 108, 7236-7240 (2011).
partners


European Synchrotron Radiation Facility - 71, avenue des Martyrs, CS 40220, 38043 Grenoble Cedex 9, France.